empty
20.03.2023 01:21 PM
Technical analysis of EUR/USD for March 20, 2023

This image is no longer relevant

Overview :

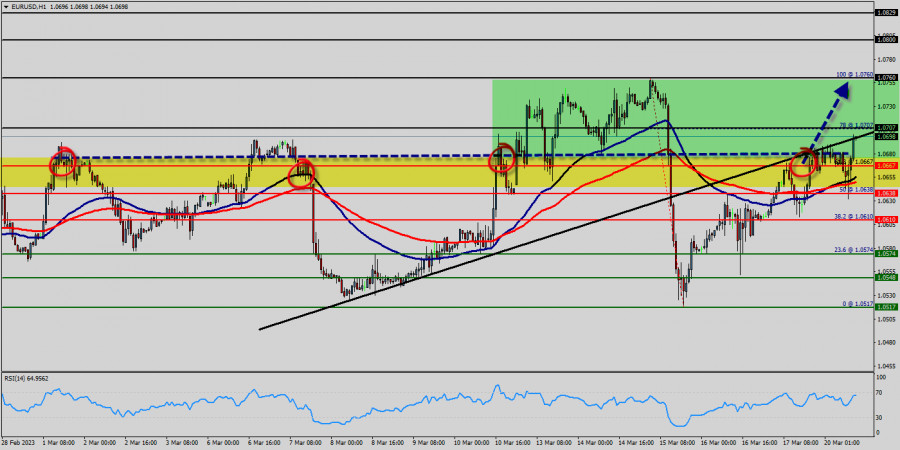
The EUR/USD pair rallied upwards strongly yesterday to breach the bearish channel's resistance and settles above it, opening the way to turn to the upside on the intraday and short-term basis, starting bullish correction for the raise measured from 1.0638 to 1.0707, noting that the first main station is located at 1.0707, which breaching it represents the key to achieve additional gains that reach 1.0707.

The bullish bias will be suggested for today, supported by the EMA100 that carries the price from above, taking into consideration that breaking 1.0707 will stop the expected rise and push the price back to the main bearish track again.

A medium term topped could be in place already, on bullish convergence condition in daily RSI. Intraday bias is now on the upside for 61.8% retracement of 1.0667 to 1.0707.

The EUR/USD pair traded higher and closed the day in the positive territory around 1.0707.

On the hourly chart, EUR/USD is still trading above the moving average line MA (100) H1 (1.0667).

Accordingly, the bullish outlook remains the same as long as the EMA 100 is pointing to the uptrend. This suggests that the pair will probably go above the daily pivot point (1.0667) in the coming hours.

The EUR/USD pair will demonstrate strength following a breakout of the high at 1.0707. The situation is similar on the one-hour chart.

Based on the foregoing, it is probably worth sticking to the north direction in trading, and as long as the EUR/USD pair remains above MA100 H1, it may be necessary to look for entry points to buy for the formation of a correction. Probably, the main scenario is continued growth towards 1.0760.

The expected trading range for today is between 1.0667 support and 1.0760 resistance.

Summary
Urgency
Analytic
Mourad El Keddani
Start trade
ইনস্টাফরেক্স দিয়ে ক্রিপ্টোমুদ্রা দর পরিবর্তনে আয় করুন।
মেটাট্রেডার 4 ডাউনলোড করে আপনার প্রথম ট্রেড চালু করুন।
  • Grand Choice
    Contest by
    InstaForex
    InstaForex always strives to help you
    fulfill your biggest dreams.
    প্রতিযোগীতায় অংশগ্রহণ করুন

সুপারিশকৃত নিবন্ধ

বিটকয়েনের ট্রেডিং সিগন্যাল, ১৮-২১ জুলাই, ২০২৫: মূল্য $118,000 (6/8 মারে - 21 SMA) এর উপরে থাকা অবস্থায় বিটকয়েন ক্রয় করুন

যদি 118,750-এর সাপোর্ট বা 118,200 এর কাছাকাছি সেকেন্ডারি আপট্রেন্ড চ্যানেলের দিকে বিটকয়েনের মূল্যের টেকনিক্যাল কারেকশন হয়, তাহলে এটিকে বিটকয়েন ক্রয়ের সুযোগ হিসেবে বিবেচনা করা হবে, যেখানে এটির মূল্যের $121,500-এর দিকে

Dimitrios Zappas 09:45 2025-07-18 UTC+2

স্বর্ণের (XAU/USD) ট্রেডিং সিগন্যাল, ১৮-২১ জুলাই, ২০২৫: মূল্য $3,330 (21 SMA - 5/8 মারে) এর উপরে থাকা অবস্থায় স্বর্ণ ক্রয় করুন

অন্যদিকে, যদি স্বর্ণের মূল্য 3,320-এর নিচে নেমে যায় এবং আপট্রেন্ড চ্যানেল ব্রেক করে নিম্নমুখী হয়, তাহলে আমরা একটি ট্রেন্ড রিভার্সালের প্রত্যাশা করতে পারি এবং তখন এটির মূল্য 4/8 মারে লাইনে

Dimitrios Zappas 08:28 2025-07-18 UTC+2

স্বর্ণের (XAU/USD) ট্রেডিং সিগন্যাল (১৭-২১ জুলাই, ২০২৫): মূল্য $3,329 (200 EMA - 5/8 মারে) এর উপরে থাকা অবস্থায় স্বর্ণ ক্রয় করা যেতে পারে

স্বর্ণ বর্তমানে 3,335 এর আশেপাশে ট্রেড করছে, যেখানে 3,320 এর সর্বনিম্ন এবং গতকাল মার্কিন সেশনে 3,377 এর সর্বোচ্চ লেভেল থেকে রিবাউন্ড করছে। মার্কিন প্রেসিডেন্ট ডোনাল্ড ট্রাম্প পাওয়েলকে বরখাস্ত করার ইঙ্গিত

Dimitrios Zappas 08:28 2025-07-17 UTC+2

বিটকয়েনের ট্রেডিং সিগন্যাল, ১৭-২১ জুলাই, ২০২৫: মূল্য 118,750-এর উপরে (200 EMA - 6/8 মারে) থাকা অবস্থায় বিটকয়েন ক্রয় করা যেতে পারে

যদি বিটকয়েনের মূল্য $115.625-এর (5/8 মারে লেভেল) নিচে নামে, যা ১৪ জুলাইয়ের সর্বনিম্ন লেভেল ছিল, তাহলে এটির মূল্য 200 EMA-এর দিকে যেতে পারে, যা $110,000-এর সাইকোলজিক্যাল লেভেলের কাছাকাছি অবস্থান করছে।

Dimitrios Zappas 08:19 2025-07-17 UTC+2

স্বর্ণের (XAU/USD) ট্রেডিং সিগন্যাল, ১৭–২০, ২০২৫ জুলাই: মূল্য $3,300 (21 SMA - 5/8 মারে) এর উপরে থাকা অবস্থায় স্বর্ণ ক্রয় করুন

ঈগল ইন্ডিকেটর একটি পজিটিভ সিগন্যাল দেখাচ্ছে। তবে, স্বর্ণের মূল্যের বিয়ারিশ চাপও বিদ্যমান, তাই আমাদের সতর্ক থাকতে হবে, কারণ আগামী দিনগুলোতে স্বর্ণের দরপতন অব্যাহত থাকতে পারে। টেকনিক্যাল রিবাউন্ডের সম্ভাবনাও রয়েছে, কারণ

Dimitrios Zappas 08:47 2025-07-16 UTC+2

GBP/USD. বিশ্লেষণ ও পূর্বাভাস

আজ GBP/USD পেয়ার 1.3430–1.3435 লেভেলের মধ্যে কনসোলিডেশনের মধ্যে রয়েছে, যেখানে এই পেয়ারের মূল্য এশিয়ান ট্রেডিং সেশনের সময় রেকর্ডকৃত তিন সপ্তাহের মধ্যে সর্বনিম্ন লেভেলের তুলনায় সামান্য ওপরে অবস্থান করছে। এই মূহূর্তে

Irina Yanina 12:22 2025-07-15 UTC+2

GBP/JPY। বিশ্লেষণ, পূর্বাভাস এবং বর্তমান বাজার পরিস্থিতি

বৃহস্পতিবার GBP/JPY পেয়ারের মূল্য আবারও ঊর্ধ্বমুখী হয়েছে এবং আরও দর বৃদ্ধির প্রস্তুতি নিচ্ছে বলে মনে হচ্ছে। একটি অ্যাসেন্ডিং চ্যানেলের গঠন বুলিশ প্রবণতার স্থিতিশীলতা নিশ্চিত করছে। এশিয়ান সেশনে, মূল্য 198.40–198.35 লেভেলের

Irina Yanina 10:29 2025-07-10 UTC+2

NZD/USD। বিশ্লেষণ, পূর্বাভাস এবং বর্তমান বাজার পরিস্থিতি

NZD/USD পেয়ার বর্তমানে 0.6000-এর সাইকোলজিক্যাল লেভেলের উপরে ট্রেড করছে; তবে, সামগ্রিকভাবে শক্তিশালী মার্কিন ডলারের প্রেক্ষিতে এই পেয়ারের মূল্যের আরও নিম্নমুখী হওয়ার ঝুঁকি রয়ে গেছে। যুক্তরাষ্ট্রের উচ্চ শুল্ক আরোপের নীতির ফলে

Irina Yanina 12:19 2025-07-09 UTC+2

XAU/USD: বিশ্লেষণ, পূর্বাভাস ও বর্তমান বাজার পরিস্থিতি

আজকের ট্রেডিং সেশনে দৈনিক ভিত্তিতে স্বর্ণের মূল্যের বিয়ারিশ প্রবণতা বজায় রয়েছে। দৈনিক চার্টে ওসিলেটরগুলো মাত্রই নেগেটিভ মোমেন্টাম দেখাতে শুরু করেছে, যা ইঙ্গিত দিচ্ছে যে স্বর্ণের আরও দরপতনের সম্ভাবনা রয়েছে। 4-ঘণ্টার

Irina Yanina 12:56 2025-07-07 UTC+2

EUR/USD পেয়ারের ট্রেডিং সিগন্যাল: ২৭-৩০ জুন, ২০২৫ – মূল্য 1.1750 (21 SMA - 8/8 মারে) লেভেলের নিচে থাকা অবস্থায় এই পেয়ার বিক্রি করুন

মার্কিন সেশনের শুরুতে, ইউরো প্রায় 1.1715 লেভেলে ট্রেড করছে, যা 1.1753 এর নতুন সর্বোচ্চ লেভেলের গঠনের পর থেকে দরপতনের শিকার হয়েছে। এই লেভেলটি অ্যাসেন্ডিং ট্রেন্ড চ্যানেলের শীর্ষসীমার সাথে মিলে গেছে

Dimitrios Zappas 16:06 2025-06-28 UTC+2
এখন কথা বলতে পারবেন না?
আপনার প্রশ্ন জিজ্ঞাসা করুন চ্যাট.
Widget callback
 

Dear visitor,

Your IP address shows that you are currently located in the USA. If you are a resident of the United States, you are prohibited from using the services of InstaFintech Group including online trading, online transfers, deposit/withdrawal of funds, etc.

If you think you are seeing this message by mistake and your location is not the US, kindly proceed to the website. Otherwise, you must leave the website in order to comply with government restrictions.

Why does your IP address show your location as the USA?

  • - you are using a VPN provided by a hosting company based in the United States;
  • - your IP does not have proper WHOIS records;
  • - an error occurred in the WHOIS geolocation database.

Please confirm whether you are a US resident or not by clicking the relevant button below. If you choose the wrong option, being a US resident, you will not be able to open an account with InstaForex anyway.

We are sorry for any inconvenience caused by this message.