We have an impulsive downward move, with the price fixing below the control point, but what is the reason and whether the quotation can maintain the existing interest - we will analyze in our article
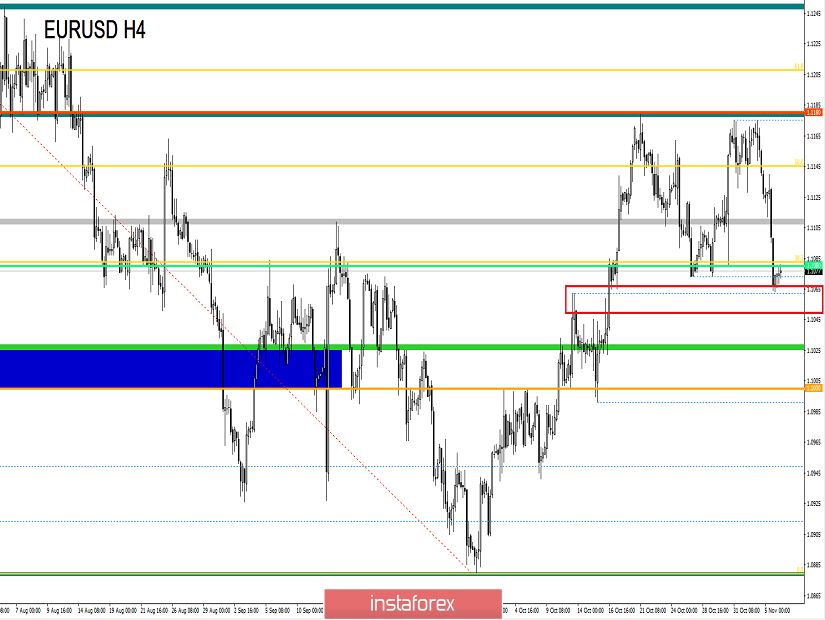
From the point of view of technical analysis, we see the long-awaited market leaps, which all are so bored with. Thus, since the beginning of the trading week, sellers have dominated the market, which at first concentrated within the resistance level of 1.1180, and then rushed down with amplification. What did you get in the end? Almost fleeting return back to the fulcrum in the form of a level of 1.1080, where we all started. In this case, the most interesting point is that the quotation still managed to fix below the control point 1.1080, which is a good sign in terms of recovery regarding an elongated correction, but at the same time, there are some nuances. So, the given movement was about a kind of emotions that stirred up the market on Monday against an information background, and here the question is brewing: How long will they last? If we ignore the fact that the quotation was fixed below the level of 1.1080, which has already brought profit to many traders, the price still failed to overcome the value of 1.1060 [the mirror level of low importance, which was a reference to the lower border of the level of 1.1080 and was starting point for major transactions]. Thus, theoretically, the fulcrum in the face of the level of 1.1080 is still preserved on the market, and in the case of the subsidence of characteristic emotions, there is the possibility of a rebound and closed oscillation within two levels of 1.1080 / 1.1180.
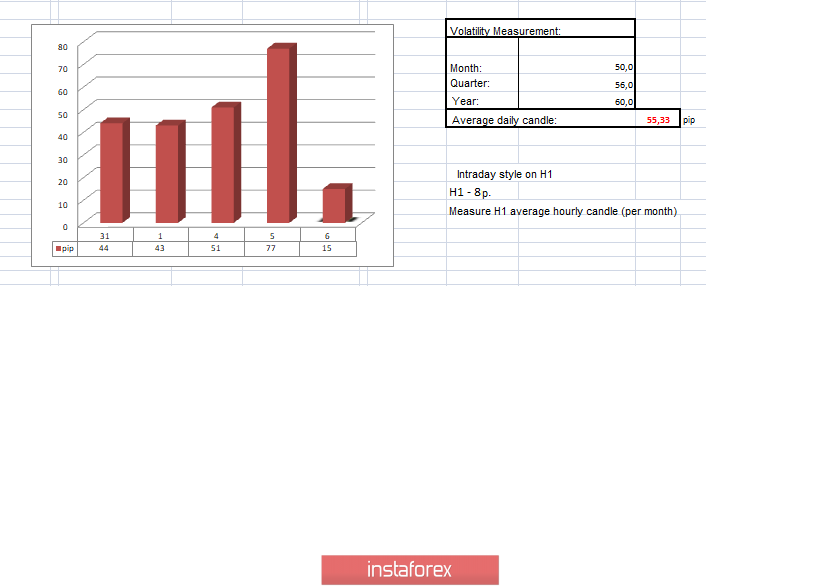
In terms of volatility, the first acceleration in three trading days was recorded yesterday, 77 points, which is 40% more than the average daily indicator.
Analyzing the past hour, we see a very interesting denouement. So, the initial rollback / stagnation during the Pacific and the beginning of the European session led to a characteristic ambiguous fluctuation, with rather low volatility, where it was as if partial fixation of trade transactions were made. Then, in the period 8:00-18:00 [UTC+00 time on the trading terminal], that same inertial movement occurred. The characteristic overbought was certainly present by the end of the day, but the stagnation with the subsequent rollback was more associated with the closure of the main trading sessions.
As discussed in the previous review, many had short positions, where some led them from the breakdown of stagnation at the peak of 1.1160 / 1.1175, others entered at the time of breaking the variable boundaries of 1.1130 / 1.1180, and the third, the most belated, entered already at the end of 1.1105, at the time of the restoration of the course after a pullback / stagnation. The most amazing thing is that everyone managed to earn their part of the profit, which cannot but rejoice.
Considering the trading chart in general terms [the daily period], we see the price returning back to the first stage of recovery with respect to the elongated correction. It is worth considering that a similar scenario already existed earlier, and it is impossible to say with complete certainty that the restoration has come, since there is still no full-fledged passage of the value 1.1060 / 1.1080. From the point of view of the technical component, recovery is a fact only in the case of a passage of more than 50% relative to an elongated correction, and at the moment, we only have 38%. At the same time, the theory of a looped horizontal stroke of 1.1080 / 1.1180 in the finish phase of an oblong correction has a chance to exist until we see a full passage of the control point.
The news background of the past day contained data on producer prices in Europe, where the decline accelerated from -0.8% to -1.2%. For the United States, the Non-Manufacturing Business Activity Index (PMI) from ISM was published, where growth was more significant than predicted from 55.2 to 57.0. Finally, there were data on open JOLTS vacancies, where they initially expected growth, but in the end, the previous figures were revised to 7.051M -> 7.301M, and the final figures came out with a decline of 7.024M.
There was no market reaction to the statistics, and the growth of the US dollar in this case was due to other factors.
So, one of the possible reasons for such a sharp strengthening of the dollar could come to us from a wave-like emotional attitude regarding US-Chinese relations. We have already heard that a number of sources confirm that Beijing plans to get Washington to abolish tariffs on a number of Chinese goods. Now there is news that the organization of a possible visit by Xi Jinping to the United States is directly related to further actions by Washington.
"The United States must provide clearer tariff commitments to China. The US side should at least refuse to introduce new duties from December 15 or stop hanging the label of the currency manipulator on the PRC, "said a government source in the PRC.
How far these steps will go in terms of improving US-Chinese relations and subsequent negotiations is not yet clear, since the process of achieving a trade deal has been going on for so long that speculators are trying to cling to at least something.
We go further on the information background and see that yesterday there was a statement by the head of the Federal Reserve Bank [FRB] of San Francisco, Mary Daily.
"I fully supported all three rate cuts this year," the head of the San Francisco Federal Reserve Bank told reporters after speaking at an event at the University of New York
The Daily also said that at this time the rate is at the right level, taking into account the pressure we are facing, and the economic forecast that takes into account this pressure.
Finally, a few words about Brexit. So, while the British are engaged in debates ahead of the parliamentary elections, Europeans are thinking about the future in terms of upcoming trade relations between the EU and Great Britain, which, in their opinion, will be difficult, since the European bloc will not tolerate an unfair competitive advantage.
"Britain should not think that a zero tariff, zero quotas will be enough," said Michel Barnier, chief negotiator for Brexit-y. He also added that there will be extremely little time for negotiations on a new partnership, negotiations will be difficult.
Today we have data on retail sales in Europe, where they expect acceleration from 2.1% to 2.5%. For the United States, no significant statistics are expected today.
Further development
Analyzing the current trading chart, we see a sluggish stagnation / rollback relative to the current level of 1.1080. In fact, the current fluctuation is more alarming than surprising, since it seems that the market has local oversold, in addition to touching an important price level, and there is no market reaction. Thus, there is a clear number of short positions that are still held by traders and they do not provide the opportunity to fully adjust the quote, which is both a plus and a minus relative to what is happening in the euro / dollar pair.
By detailing the available time interval, we see a very sluggish oscillation with a small upward angle, where the level of 1.1080 currently plays the role of resistance.
In turn, traders have fixed most of their short positions, which is considered a completely right step, since the fulcrum in the face of the level of 1.1080 has been repeatedly confirmed in the market. Now the price is being monitored, as there are attractive positions for both buying and selling.
It is likely to assume that the first development will be in terms of a pullback, where in case of fixing a price higher than 1.1080, we will be pulled towards 1.1090 / 1.1095. Furthermore, it is worth looking at the behavior of the quote and whether it can hold on to the values of 1.1090 / 95, since in the case of the next development of the level of 1.1080, we can be pulled back into the range fluctuation of 1.1080 / 1.1180. An alternative scenario is considered in terms of restoring relatively elongated correction, and here it is worth carefully analyzing the value of 1.1060, since in case of fixing below we can go on to form step # 2.
Based on the above information, we derive trading recommendations:
- We consider buying positions in case of fixing and working out the level of 1.1080, with the initial move in terms of a rollback to 1.1090-1.1095. Extension of positions from 1,1100.
- We consider selling positions in case of price fixing lower than 1.1060.
Indicator analysis
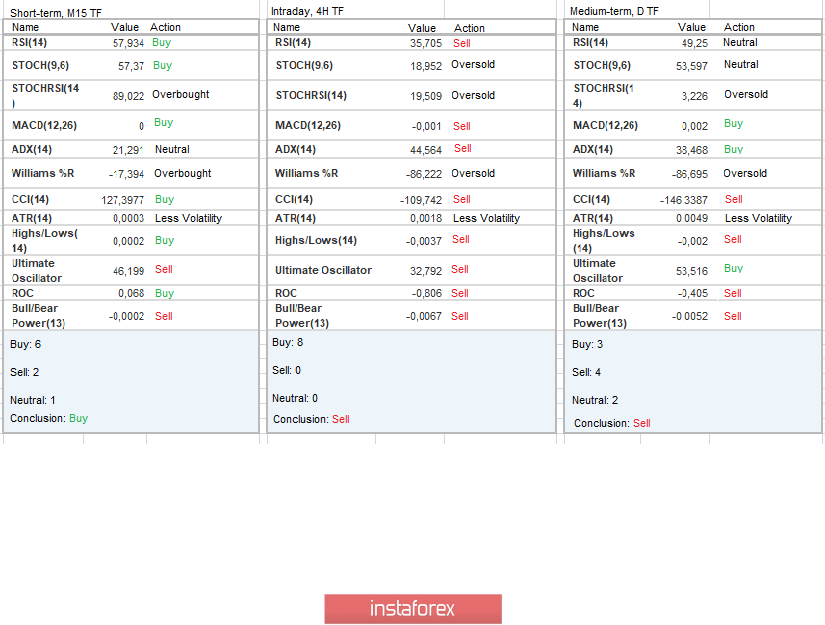
Analyzing a different sector of timeframes (TF), we see a very interesting picture, indicators in the medium term over a long time have changed their mood from upward to downward, although the indicators are not yet completely stable. On the other hand, intraday intervals are focused on the impulsive move, signaling sales, while short-term intervals work on existing pullback / stagnation.
Volatility per week / Measurement of volatility: Month; Quarter; Year
Measurement of volatility reflects the average daily fluctuation, calculated for the Month / Quarter / Year.
(November 6 was built taking into account the time of publication of the article)
The volatility of the current time is 15 points, which is a low indicator for this period of time. It is likely to assume that there is still a chance of acceleration, in case of breakdown or proper development of the level of 1.1080. Unless, of course, we are drawn into a narrow stagnation along the level of 1.1080.
Key levels
Resistance Zones: 1.1180 *; 1.1300 **; 1.1450; 1.1550; 1.1650 *; 1.1720 **; 1.1850 **; 1,2100
Support Areas: 1,1080 **; 1,1000 ***; 1.0900 / 1.0950 **; 1.0850 **; 1,0500 ***; 1.0350 **; 1,0000 ***.
* Periodic level
** Range Level
*** Psychological level
***** The article is built on the principle of conducting a transaction, with daily adjustment