GBP/USD
Brief analysis:
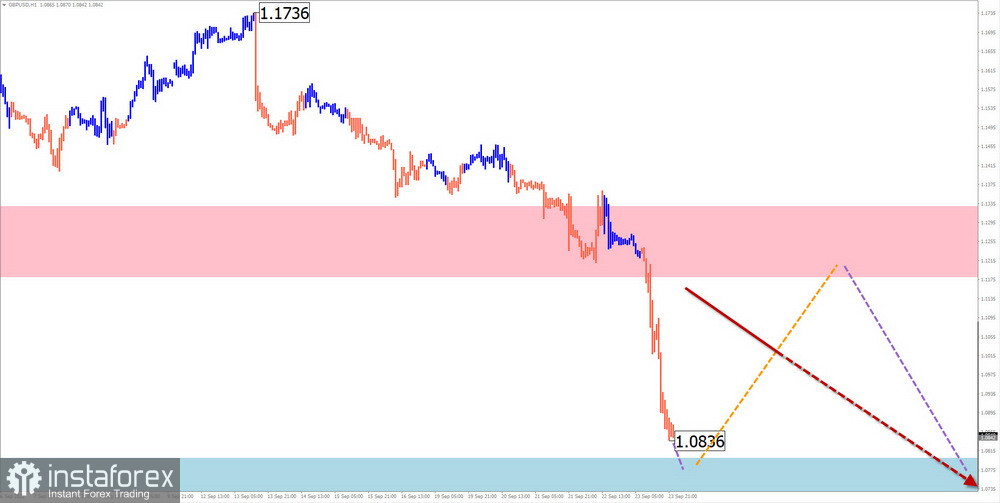
Last week, the quotes of the British pound sterling updated the historical minimum of March 2020. The broken support turned into a powerful resistance. Quotes are approaching another powerful potential reversal zone. Moreover, the unfinished wave section has been counting since September 13 and has a pronounced impulse character. There is a need for correction in the wave structure.
Forecast for the week:
At the beginning of the coming week, the bearish movement vector is expected to continue up to contact with the settlement support. After that, you can count on the transition of the price movement to the side plane, followed by a rebound of quotes. The resistance zone demonstrates the maximum possible expected growth range.
Potential reversal zones
Resistance:
- 1.1180/1.1230
Support:
- 1.0800/1.0750
Recommendations
Sales: the potential is limited by the nearest support. Transactions are possible with a reduced lot within the framework of individual sessions.
Purchases: are not recommended until the support area is confirmed by your vehicle signals.
AUD/USD
Brief analysis:
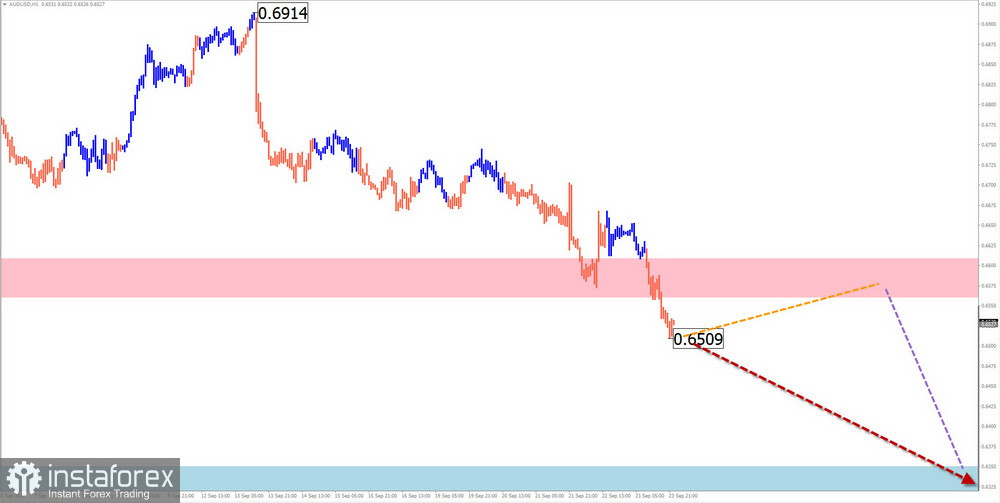
The direction of the price movement of the major Australian dollar since February last year has been set by a downward wave. Its unfinished section has been counting since August 11. In the wave structure in the last decade, the final part (C) is formed, which has an impulse form.
Forecast for the week:
At the beginning of the upcoming week, there is a high probability of the price movement moving sideways. A short-term rise in the area of the resistance zone is not excluded. Then you can count on the formation of a reversal and the resumption of the downward course of movement.
Potential reversal zones
Resistance:
- 0.6560/0.6610
Support:
- 0.6350/0.6300
Recommendations
Purchases: there are no conditions on the pair's market for transactions.
Sales: recommended at the end of corrective pullbacks in calculated resistance.
USD/CHF
Brief analysis:
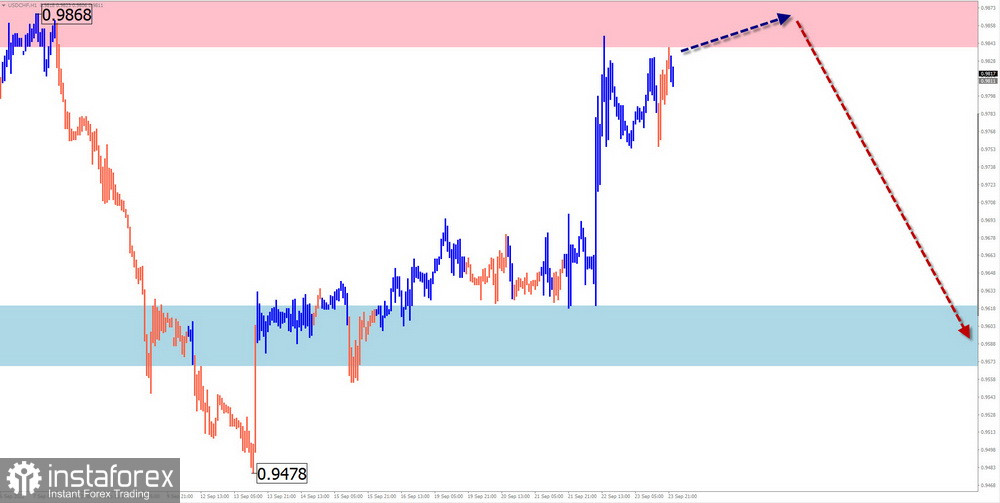
An upward wave sets the trend direction of the Swiss franc. After the completed correction, the next wave zigzag on the main course started on August 11. Quotes have come close to the lower border of a strong potential reversal zone of the weekly scale of the chart. Since September 22, a descending wave of a small scale has been developing downward, having a reversal potential. If confirmed, this will be the beginning of a corrective decline.
Forecast for the week:
At the beginning of the coming week, the general flat mood of the movement is expected to continue along the borders of the resistance zone. In the following days, the probability of a change in direction and the beginning of the price move increases. The support zone shows the lower limit of the expected weekly course of the pair.
Potential reversal zones
Resistance:
- 0.9840/0.9890
Support:
- 0.9620/0.9570
Recommendations
Purchases: have a small potential and can lead to losses of the deposit.
Sales: will become possible after the appearance of confirmed reversal signals in the area of the resistance zone.
EUR/JPY
Brief analysis:
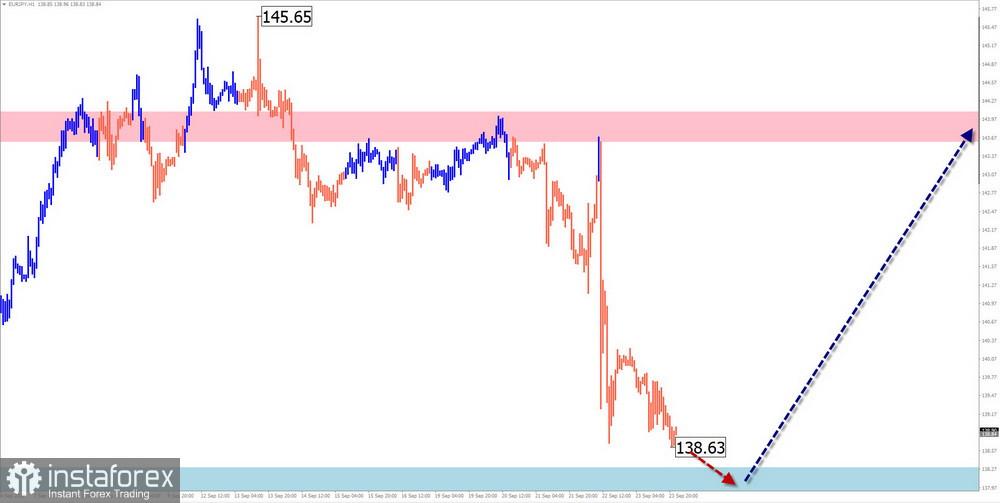
Quotes of the euro cross against the Japanese yen have been moving to the "north" of the price chart since March. The unfinished section of the trend has been reported since August 2. In the structure of the wave, the middle part (B) is nearing completion. Quotes are approaching the upper limit of the powerful support zone of the monthly scale of the chart.
Forecast for the week:
A decline in quotes to the boundaries of the settlement support zone is most likely. In the second half, the probability of forming a reversal and changing the direction of movement to an upward one increases.
Potential reversal zones
Resistance:
- 143.60/144.10
Support:
- 138.30/137.80
Recommendations
Sales: have a small potential, and are possible within a separate session with a fractional lot.
Purchases: recommended after the appearance of signals confirmed by your vehicle in the area of the support zone.
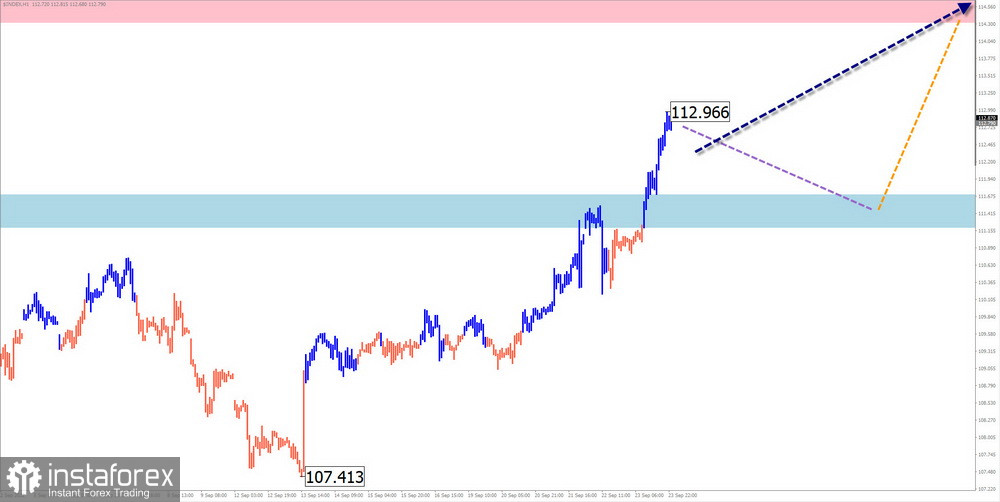
US Dollar Index
Brief analysis:
The trend direction of the US dollar index since the beginning of last year has an upward vector. The values reached record peaks 20 years ago. The unfinished section of the trend has been counting since August 10. In the structure of this wave, the final part (C) develops. The previously depressed resistance level has become powerful support.
Forecast for the week:
At the beginning of the upcoming week, the probability of the index movements moving to the side plane remains. A decline to support levels is not excluded. In the following days, an increase in activity and the resumption of the upward course are expected. The resistance zone shows the upper limit of the expected weekly movement of the index.
Potential reversal zones
Resistance:
- 114.30/114.80
Support:
- 111.70/111.20
Recommendations
Sales: deals to weaken the dollar's position will become possible in the coming days with a reduced lot.
Purchases: the weakening of the positions of national currencies and the strengthening of the US dollar should be a priority in transactions in the coming week.
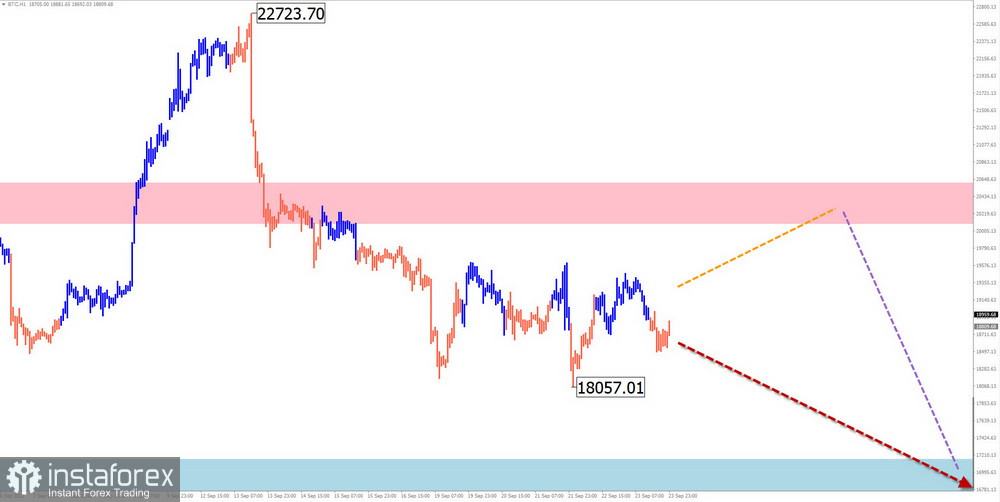
#Bitcoin
Brief analysis:
Bitcoin quotes, after a long period of decline, froze in the area of a powerful support zone. The width of the zone allows the price to move within ten price figures. After the recent sideways correction, a new downward wave on a small scale started on September 13. An intermediate correction has been developing in the structure of this wave over the past week.
Forecast for the week:
At the beginning of the upcoming week, bitcoin quotes are expected to continue the lateral vector of movement along the boundaries of the resistance zone. At the same time, there may be an increase in volatility and a resumption of the downward course. A break below the limits of the settlement support within the weekly period is unlikely.
Potential reversal zones
Resistance:
- 20100.0/20600.0
Support:
- 17150.0/16650.0
Recommendations
Purchases: in the current market, conditions are highly risky and are not recommended.
Sales: this will become possible after the appearance of reversal signals in the area of the resistance zone, confirmed by your vehicle.
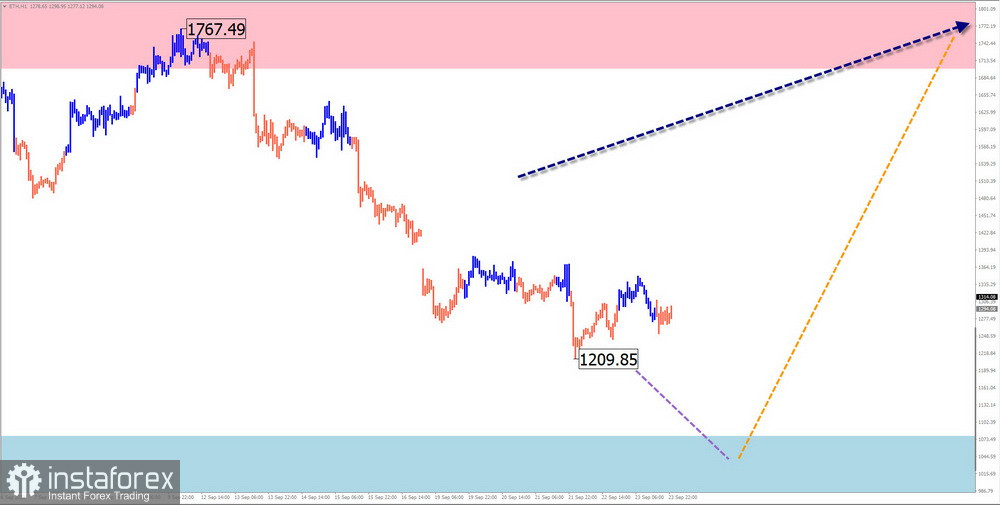
#Ethereum
Brief analysis:
A bearish trend dominates the chart of this altcoin. Since June, Ethereum quotes have been moving laterally along the upper border of the powerful support zone of a large TF. The middle part (B) has been forming in the wave structure since last month. This movement is close to completion, but there are no signals of an imminent reversal on the chart.
Forecast for the week:
The first half of the coming week is expected to have a general downward vector, with the price falling to the levels of the support zone. In the following days, there is a high probability of a reversal and a resumption of price growth. The resistance zone demonstrates the upper limit of the expected range of the ether's weekly course.
Potential reversal zones
Resistance:
- 1700.0/1850.0
Support:
- 1080.0/930.0
Recommendations
Sales: possible within the framework of individual trading sessions with a fractional lot.
Purchases: are not recommended until the appearance of reversal signals is confirmed by all types of analysis in the area of the support zone.
Explanations: In simplified wave analysis (UVA), all waves consist of 3 parts (A-B-C). At each TF, the last and incomplete wave is analyzed. The dotted line shows the expected movements.
Attention: the wave algorithm does not consider the duration of the movements of the instruments in time!