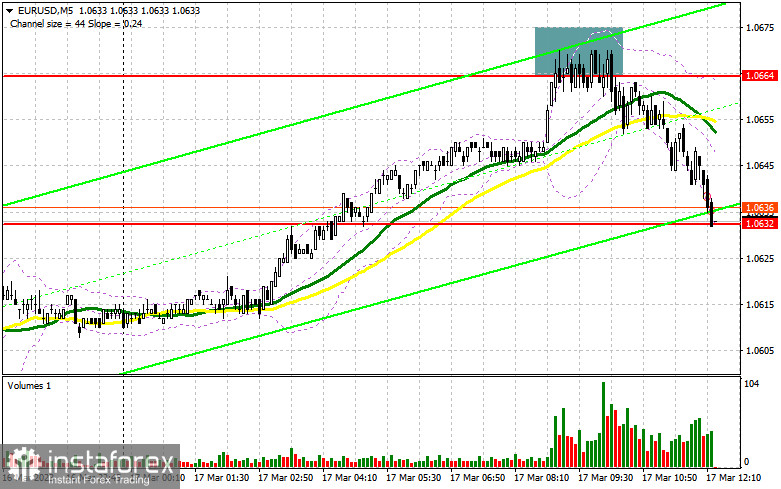
In my morning forecast, I focused on the level of 1.0664 and offered recommendations based on it for market entry decisions. Let's take a look at the 5-minute chart and see what happened. The pair dropped more than 30 points, testing the nearest support at 1.0632, as a result of the increase and development of a false collapse in the area of 1.0664, which served as a sell signal for the euro. The technical situation and the strategy itself have not changed for the second half of the day.
If you want to trade long positions on EUR/USD, you will need:
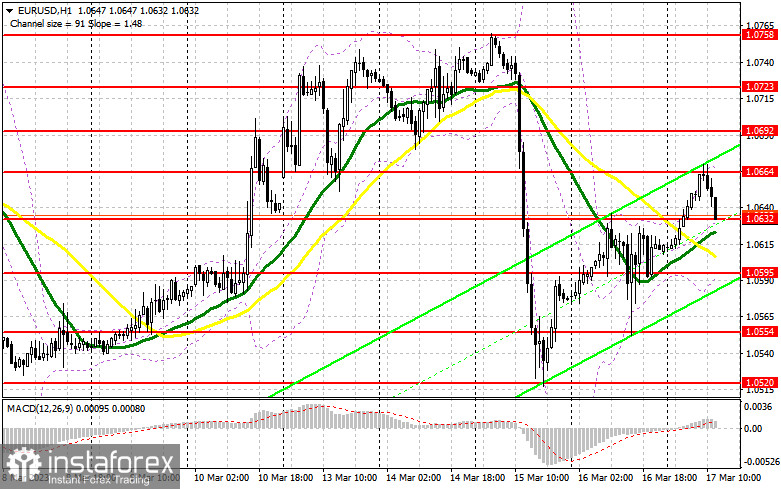
The recent figures on inflation in the eurozone completely matched economists' predictions: total inflation decreased to 8.5% per year, while the base increased from 5.3% to 5.6%. This is completely unhelpful for the European Central Bank and forces it to maintain its tough policymaking. The focus will now shift to the University of Michigan figures on industrial production, the expectations index, and the consumer confidence index in the afternoon. Positive indicators could put more pressure on the euro, which would trigger a struggle for the nearest level of support at 1.0632. The formation of a false breakout there will suggest the opening of long positions in anticipation of another breakthrough at 1.0664 because the technical picture has not changed. This level's breakout and top-down test provide an extra entry point for developing long positions with a move to 1.0692, where bulls will struggle. The bears' stop orders will be hit by the collapse of 1.0692, providing a further signal with the potential to move to 1.0723, where I will fix profits. Nevertheless, only extremely weak data about the American economy will allow for the development of such a situation. The next support level of 1.0595 will be reached if EUR/USD weakens in the afternoon and there are no buyers at 1.0632, which is also likely given that pressure on the euro might resume at any time. Only the emergence of a false collapse will provide a signal to purchase the euro. For a rebound from the low of 1.0554, or even lower (around 1.0520), I will begin long positions right away with the target of an upward corrective of 30-35 points during the day.
If you want to trade short positions on EUR/USD, you'll need:
Sellers managed the morning task and prevented the pair from rising beyond 1.0664. They are now aiming for 1.0632, which is the closest support, but you should also remember that 1.0664 provides protection. The development of a false collapse there, similar to what I stated above, will be the best-case scenario for starting additional short positions if the euro rises higher after the US data. The euro will drop as a result to close to the nearest level of support at 1.0632, just below which the moving averages are supporting the bulls. The pair will drop much more if this range is broken and reversal tested, which will serve as another signal to start short positions with an exit at 1.0595. Fixing below this level upon the release of US data will result in a stronger decline to the area of 1.0554, where I will take profit. As this level has already worked itself out once today, I suggest you delay opening short positions until the level of 1.0692 if the EUR/USD rises throughout the American session and there are no bears at 1.0664. You can sell only after an unsuccessful consolidation. In anticipation of a rebound from the high point of 1.0723, I will open short positions right away with a 30- to 35-point corrective in mind.
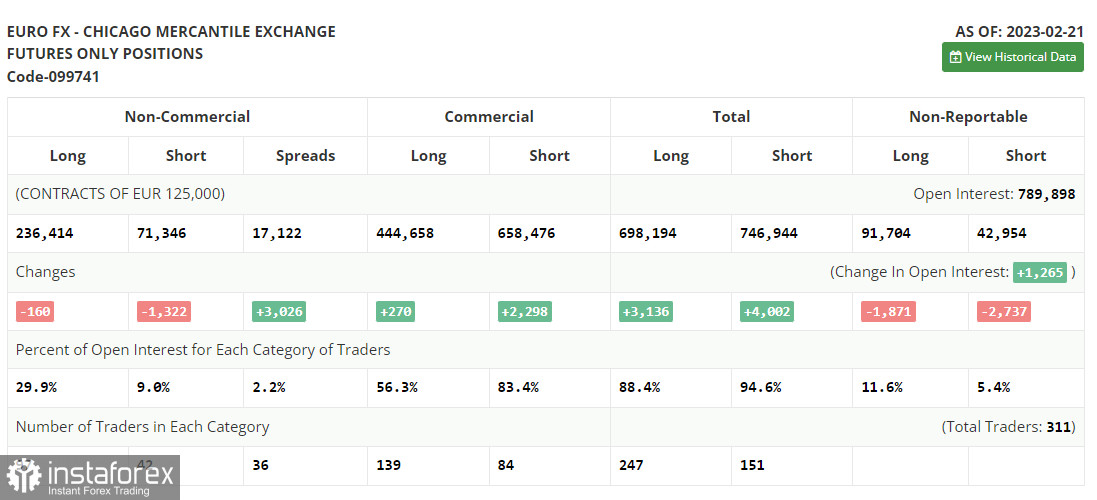
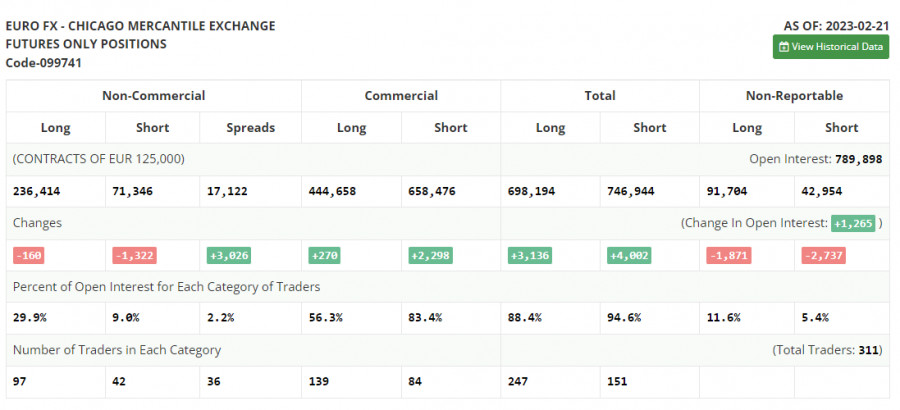
In the COT report (Commitment of Traders) for February 21, fewer long and short positions were reported. It should be clear that these data are of no interest at the moment because, amid the CFTC cyberattack, statistics are only now starting to catch up, making the data from one month ago less useful. I'll hold off till new reports are released and rely on more recent data. Inflation in the US is one of the significant events this week, and it could finally increase traders' confidence that the Fed and Jerome Powell won't resume their tough stance, as was stated last week. The possibility of the US banking industry collapsing (a risk that emerged with the BSV bankruptcy) will undoubtedly change Fed policymakers' assessments of how much more they need to raise interest rates to "finish off" the economy. According to the COT data, the number of long non-commercial positions fell by 160 to reach 236,414 while the number of short non-commercial roles fell by 1,322 to reach 71,346. The total non-commercial net position rose to 165,038 from 150,509 after the week. The weekly closing price fell from 1.0742 to 1.0698.
Signals from indicators
Moving Averages
The fact that trading is taking place above the 30 and 50-day moving averages suggests that the market is attempting to change course.
Notably, the author considers the time and prices of moving averages on the hourly chart H1 and departs from the standard definition of the traditional daily moving averages on the daily chart D1.
Bands by Bollinger
The indicator's upper limit, which is located around 1.0664, will serve as resistance in the event of growth.
Description of indicators
- Moving average (moving average determines the current trend by smoothing out volatility and noise). Period 50. The graph is marked in yellow.
- Moving average (moving average determines the current trend by smoothing out volatility and noise). Period 30. The graph is marked in green.
- MACD indicator (Moving Average Convergence / Divergence - moving average convergence/divergence) Fast EMA period 12. Slow EMA period 26. SMA period 9
- Bollinger Bands (Bollinger Bands). Period 20
- Non-profit speculative traders, such as individual traders, hedge funds, and large institutions use the futures market for speculative purposes and to meet certain requirements.
- Long non-commercial positions represent the total long open position of non-commercial traders.
- Short non-commercial positions represent the total short open position of non-commercial traders.
- Total non-commercial net position is the difference between the short and long positions of non-commercial traders.