Analyzing Monday's trades:
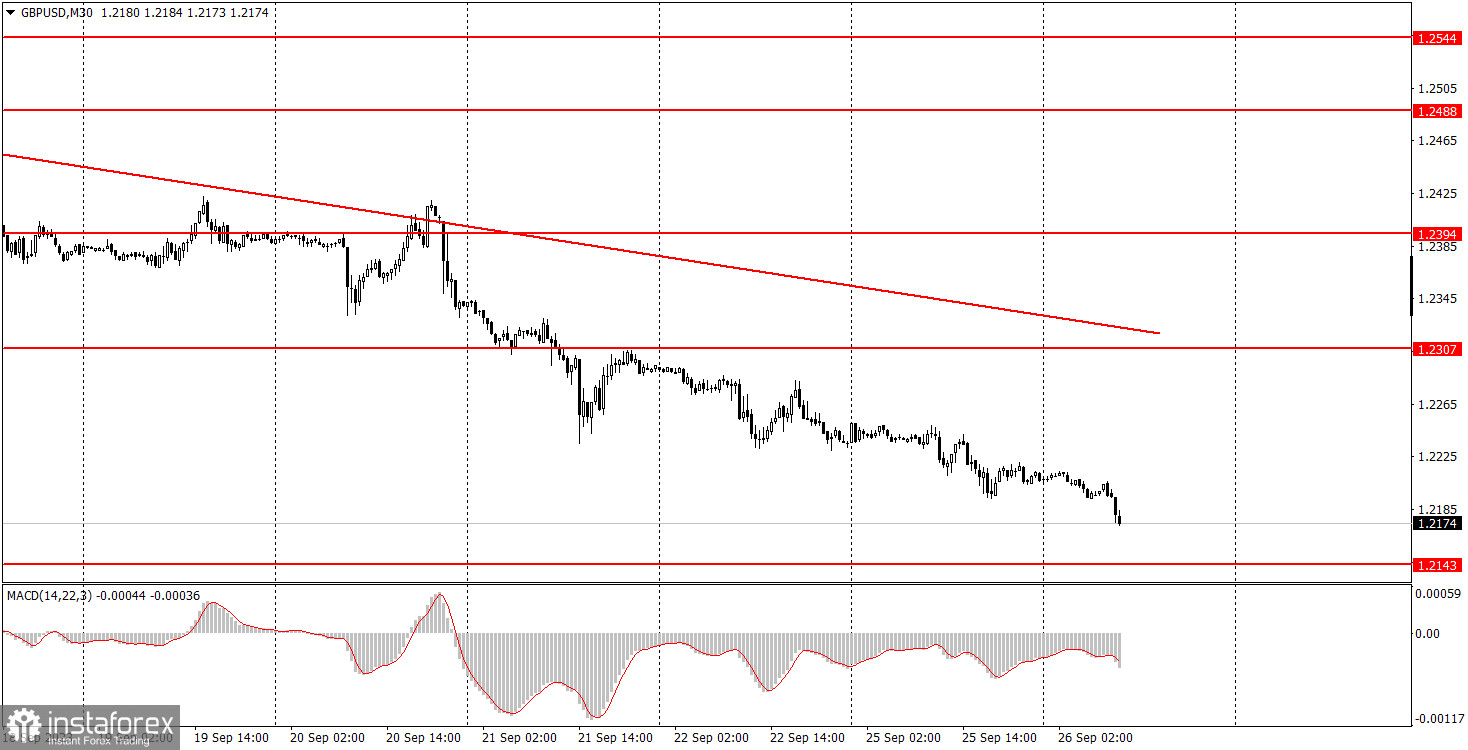
GBP/USD on 30M chart
GBPUSD was under selling pressure at the end of Monday. While the euro occasionally attempts to correct or at least trade in a flat range, it appears that the pound is falling almost every day. And this may be due to the fact that the pound has been rising for about a year, with at least 6 months of illogical growth (as we have repeatedly mentioned). Therefore, this is simply a means to "restore balance" in the market. For example, yesterday, there were no events in the US or the UK that could have triggered the pound's decline. Volatility was low, in line with the strength of the macroeconomic background, but the pound still fell. And so we came to the conclusion that there are currently no issues about the direction of the trend.
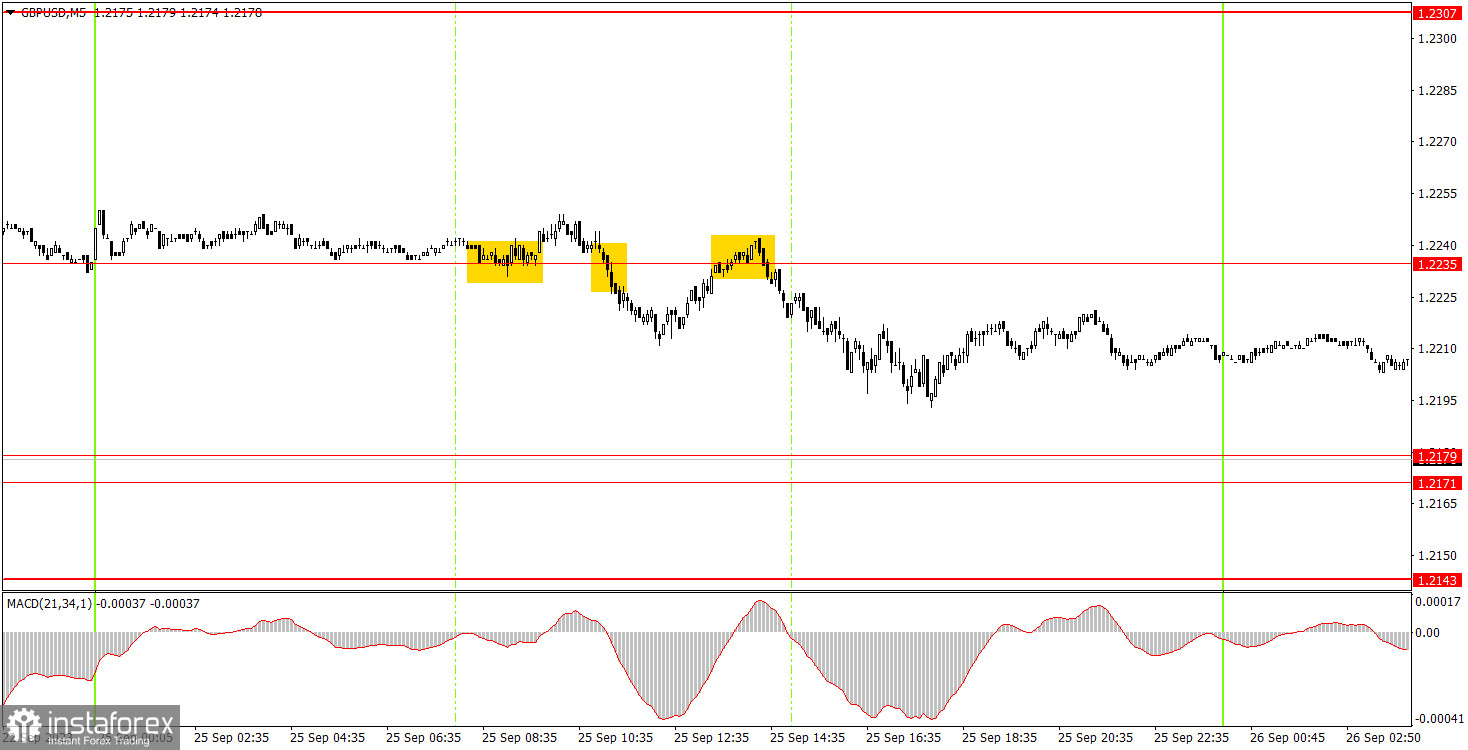
GBP/USD on 5M chart
Three trading signals were formed on the 5-minute chart, but the nature of the movement left much to be desired, and volatility was 56 pips. The first buy signal, a bounce from the level of 1.2235, turned out to be false, and the next two sell signals (which duplicated each other) near the same level... were also false, but at least you could set the stop-loss at breakeven. The first trade closed with a small loss, but the second trade could have resulted in a small profit. Consequently, closing short positions had to be done manually, and the profit from them was 20 pips, which made it possible to offset the loss from the first trade.
Trading tips on Tuesday:
On the 30-minute chart, GBP/USD has experienced several challenging days, with the downtrend still in place and the fundamental backdrop getting worse for the British currency. Therefore, it may enter a bullish correction in the near future (simply because there is a technical need for it), but in the long run, we expect the pound to continue its downward movement. At the moment, there are no signs of a stable correction. The key levels on the 5M chart are 1.2065-1.2079, 1.2143, 1.2171-1.2179, 1.2235, 1.2307, 1.2372-1.2394, 1.2457-1.2488, 1.2544, 1.2605-1.2620, 1.2653, 1.2688. Once the price moves 20 pips in the right direction after opening a trade, you can set the stop-loss at breakeven. On Tuesday, there are no interesting events or news scheduled in the UK and the US. The report on new home sales in the US is hardly important.
Basic trading rules:
1) The strength of the signal depends on the time period during which the signal was formed (a rebound or a break). The shorter this period, the stronger the signal.
2) If two or more trades were opened at some level following false signals, i.e. those signals that did not lead the price to Take Profit level or the nearest target levels, then any consequent signals near this level should be ignored.
3) During the flat trend, any currency pair may form a lot of false signals or do not produce any signals at all. In any case, the flat trend is not the best condition for trading.
4) Trades are opened in the time period between the beginning of the European session and until the middle of the American one when all deals should be closed manually.
5) We can pay attention to the MACD signals in the 30M time frame only if there is good volatility and a definite trend confirmed by a trend line or a trend channel.
6) If two key levels are too close to each other (about 5-15 pips), then this is a support or resistance area.
How to read charts:
Support and Resistance price levels can serve as targets when buying or selling. You can place Take Profit levels near them.
Red lines are channels or trend lines that display the current trend and show which direction is better to trade.
MACD indicator (14,22,3) is a histogram and a signal line showing when it is better to enter the market when they cross. This indicator is better to be used in combination with trend channels or trend lines.
Important speeches and reports that are always reflected in the economic calendars can greatly influence the movement of a currency pair. Therefore, during such events, it is recommended to trade as carefully as possible or exit the market in order to avoid a sharp price reversal against the previous movement.
Beginners should remember that every trade cannot be profitable. The development of a reliable strategy and money management are the key to success in trading over a long period of time.