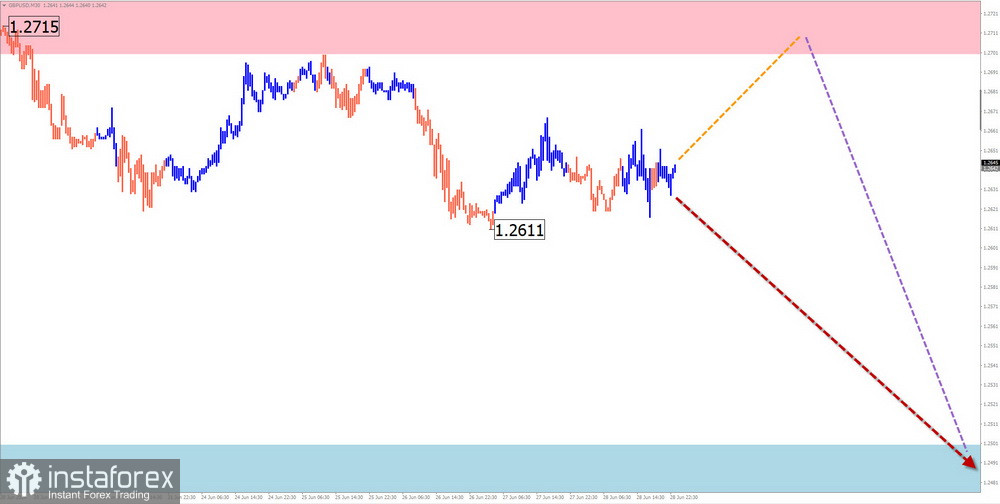
GBP/USD
Analysis:
The structure of the downward wave of the major British pound sterling that started in July last year shows incompleteness at the time of analysis. The pair's quotes form a downward segment from the boundaries of a strong potential reversal zone. Its wave level exceeds the size of the pullback. Upon confirmation, the final segment of the main wave will start.
Forecast:
The British pound sterling's sideways movement is expected to continue in the coming trading days. A price pullback to the resistance zone is likely, followed by a reversal and resumption of the bearish movement toward the calculated support levels.
Potential Reversal Zones
Resistance:
Support:
Recommendations:
Sales: Possible if reversal signals confirmed by your trading system appear in the resistance zone.
Purchases: Trades in this direction may lead to losses.
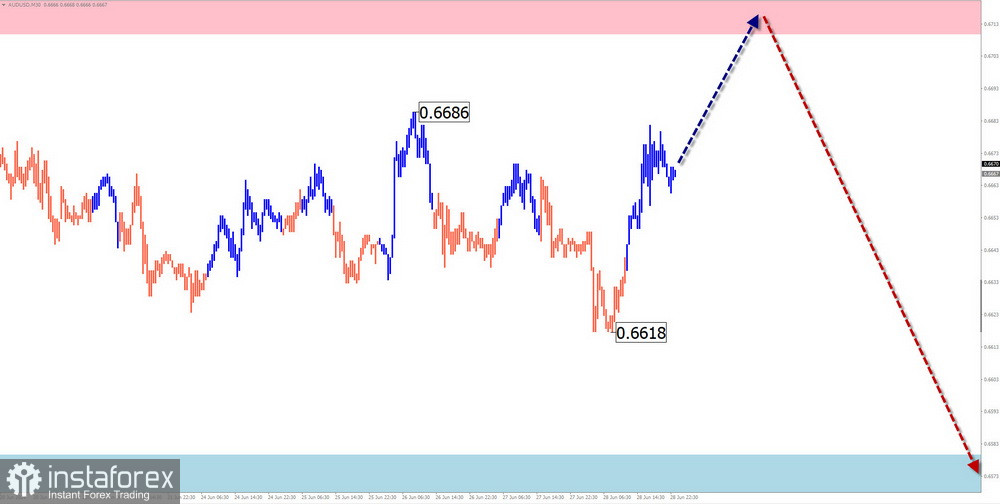
AUD/USD
Analysis:
The current price fluctuations of the major Australian dollar pair, which have been ongoing since July last year, fit into the algorithm of a downward corrective flat. The bearish wave that began in mid-May, in the form of a horizontal flat, forms the beginning of the final part of the main wave.
Forecast:
The pair is expected to continue its sideways movement in the coming week. A brief upward price bounce to resistance levels cannot be ruled out in the next couple of days. By the end of the week, the probability of a reversal and the start of a decline increases up to the contact with the support zone.
Potential Reversal Zones
Resistance:
Support:
Recommendations:
Purchases: Possible within intraday sessions. The potential is limited by resistance.
Sales: This can be used in trading after confirmed reversal signals appear in the resistance zone.
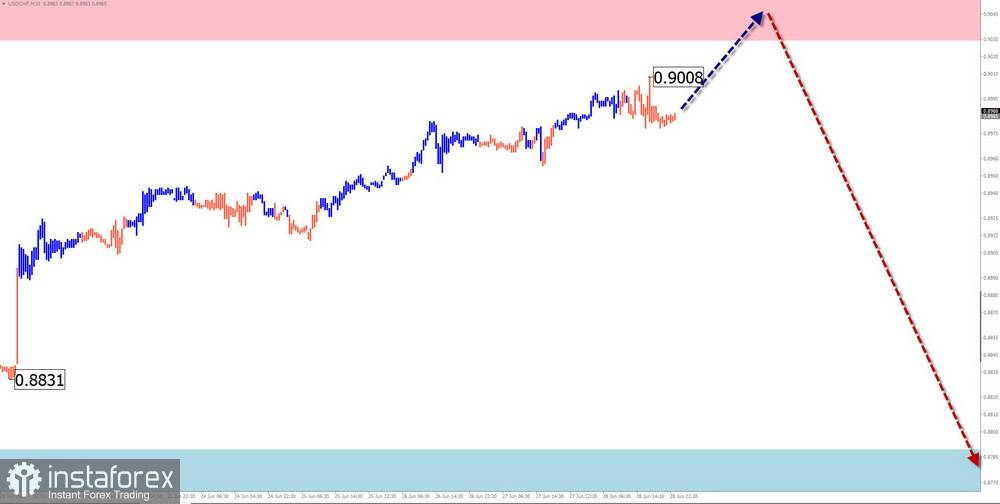
USD/CHF
Analysis:
The current price fluctuations of the major Swiss franc pair since December last year fit into the algorithm of an upward wave. The bearish wave that began in May forms a correction to the main trend. This movement does not show completion at the time of analysis.
Forecast:
The pair is expected to continue its overall sideways movement in the coming week. The price will likely continue rising in the next couple of days, but not above the resistance level. By the end of the week, the chance of a reversal and the beginning of a decline increases up to the contact with the support zone.
Potential Reversal Zones
Resistance:
Support:
Recommendations:
Purchases: Possible within individual sessions. The potential is limited by resistance.
Sales: This can be used in trading after confirmed reversal signals appear in the resistance zone.
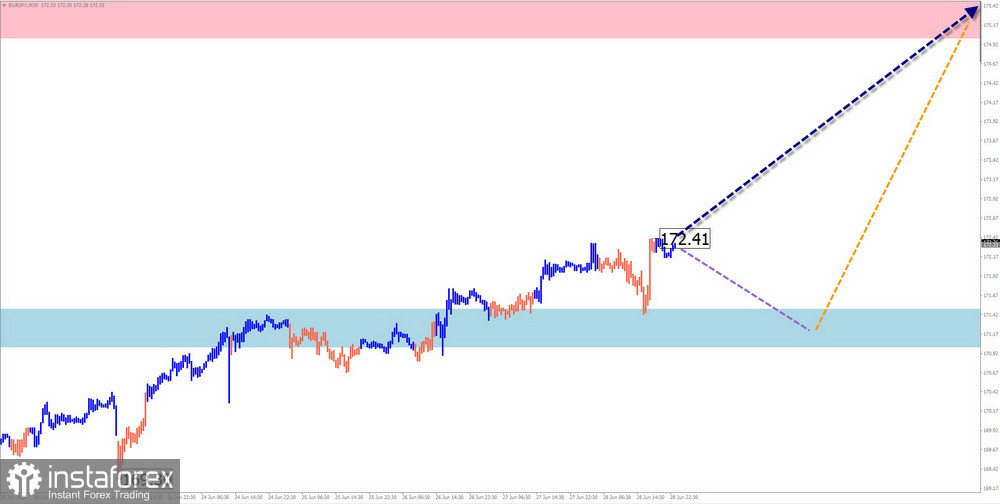
EUR/JPY
Analysis:
Over the past few years, the EUR/JPY cross rate has formed a stable upward trend. The currently incomplete upward segment of the trend from May 3 leads the pair's quotes toward the boundaries of a strong potential reversal zone. The wave structure indicates a need for correction, but no signals of an imminent change in direction were observed on the chart at the time of analysis.
Forecast:
In the coming week, the current rise is expected to continue up to the boundaries of the calculated resistance. A brief sideways movement or decline towards the support boundaries is not excluded in the next few days. By the end of the current week, active growth in the cross rate is anticipated to resume.
Potential Reversal Zones
Resistance:
Support:
Recommendations:
Purchases: This will become possible after confirmed signals appear on your trading systems.
Sales: The pair's market will have no trade conditions in the coming days.
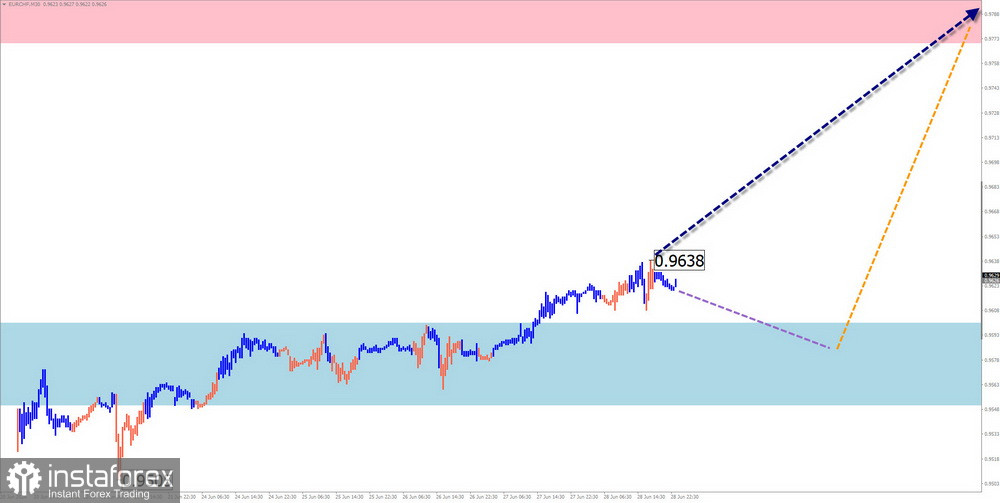
EUR/CHF
Analysis:
An upward wave has set the primary direction of the EUR/CHF cross rate in the short term since December last year. The currently incomplete upward segment of the trend from June 19 has initiated the final segment (C) of the primary trend. The price has rebounded from the upper boundary of a strong potential reversal zone. The wave structure indicates a need for an intermediate correction.
Forecast:
In the coming week, the current rise is expected to continue up to the boundaries of the calculated resistance. A brief sideways flat movement along the support boundaries is not excluded in the next couple of days. By the end of the current week, active growth in the cross rate is anticipated to resume.
Potential Reversal Zones
Resistance:
Support:
Recommendations:
Purchases: This will become possible after confirmed signals appear on your trading systems.
Sales: There will be no trade conditions in the cross market in the coming days.
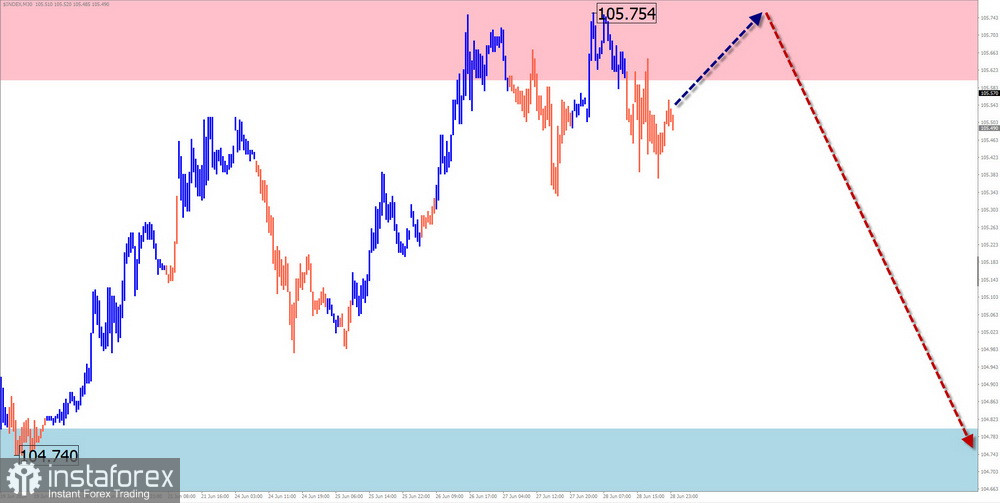
USD Index
Analysis:
The US Dollar Index continues its six-month movement in a sideways corridor along the upper boundary of a strong potential reversal zone on the monthly scale. The analysis of the upward segment that began on June 12 indicates the incompleteness of its structure. A corrective decline is necessary.
Forecast:
The complete end of the US dollar's current flat movement is expected by the end of the current week. In the area of the calculated resistance, a reversal and the resumption of the downward course can be anticipated. The calculated support marks the lower boundary of the instrument's expected weekly range.
Potential Reversal Zones
Resistance:
Support:
Recommendations:
In the coming days, we will witness another change in the direction of the US dollar positions. This period may last for a couple of weeks. During this time, it is recommended that trading positions be exited and that national currencies in the major pairs be prepared for the next strengthening.
Explanations: In simplified wave analysis (SWA), all waves consist of three parts (A-B-C). In each timeframe, only the last incomplete wave is analyzed. The formed structure is shown with a solid background arrow, and the expected movements are shown with a dashed line.
Attention: The wave algorithm does not consider the duration of instrument movements over time!