empty
29.09.2023 11:09 PM
Technical analysis on EUR/USD for September 29, 2023

This image is no longer relevant

Overview:

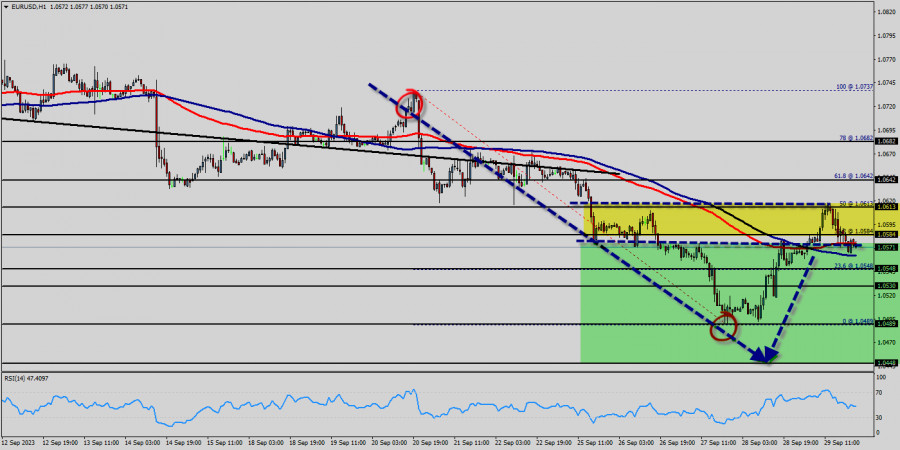
The EUR/USD pair steadies near 1.0571 after USD slide. The EUR/USD pair reached a peak of 1.0571 following the release of a weak ISM Services PMI report from the US. The EUR/USD pair is currently hovering near the 1.0571 level, unchanged for the day. The EUR/USD pair trades with modest losses, not far above the two-week low posted last week at 1.0636.

Technical readings in the daily chart favor a downward extension as a bearish 50 Simple Moving Average (SMA) heads south below a flat 100 SMA, both above the current level. Also, the pair remains above a critical static support level, the 23.6% Fibonacci retracement of the 2023 yearly slump at 1.0682.

Finally, technical indicators remain within positive levels, with neutral-to-bullish slopes. The EUR/USD pair broke resistance which turned to strong support at the level of 1.0682 yesterday. The level of 1.0682 coincides with 23.6% of Fibonacci, which is expected to act as major support today.

Since the trend is above the 23.6% Fibonacci level, the market is still in an uptrend. From this point, the EUR/USD pair is continuing in a bullish trend from the new support of 1.0682. Currently, the price is in a bullish channel. According to the previous events, we expect the EUR/USD pair to move between 1.0682 and 1.0789.

On the H1 chart, resistance is seen at the levels of 1.0757 and 1.0789. Also, it should be noticed that, the level of 1.0734 represents the daily pivot point. Therefore, strong support will be formed at the level of 1.0682 providing a clear signal to buy with the targets seen at 1.0734.

If the trend breaks the support at 1.0734 (first resistance) the pair will move upwards continuing the development of the bullish trend to the level 1.0789 in order to test the daily resistance 2. However, stop loss is to be placed below the level of 1.0636 - last bearish wave. The EUR/USD pair continues to move upwards from the level of 1.0687.

The pair rose from the level of 1.0687 (the level of 1.0687 coincides with a ratio of 0% Fibonacci retracement - last bearish wave) to a top around 1.0754. Today, the first support level is seen at 1.0687 followed by 1.0600, while daily resistance 1 is seen at 1.0785.

According to the previous events, the EUR/USD pair is still moving between the levels of 1.0687 and 1.0785; for that we expect a range of 98pips (1.0785 - 1.0687). On the one-hour chart, immediate resistance is seen at 1.0785, which coincides with a ratio of 50% Fibonacci retracement - the first bullish wave.

Currently, the price is moving in a bullish channel. This is confirmed by the RSI indicator signaling that we are still in a bullish trending market. The price is still above the moving average (100) and (50).

Therefore, if the trend is able to break out through the first resistance level of 1.0785, we should see the pair climbing towards the daily resistance at 1.0808 to test it. It would also be wise to consider where to place stop loss; this should be set below the second support of 1.0687.

Pilih timeframe
5
mnt
15
mnt
30
mnt
1
jam
4
jam
1
hari
1
minggu
Dapatkan keuntungan dari perubahan nilai mata uang kripto dengan InstaForex.
Unduh MetaTrader 4 dan buka perdagangan pertama Anda.
  • Grand Choice
    Contest by
    InstaForex
    InstaForex always strives to help you
    fulfill your biggest dreams.
    GABUNG KONTES

Artikel yang direkomendasikan

Prediksi EUR/USD untuk 23 Mei 2025

Data PMI Zona Euro untuk bulan Mei, yang dipublikasikan kemarin, mengecewakan. PMI Manufaktur turun dari 49,0 menjadi 48,4 (dibandingkan dengan ekspektasi 49,2), dan PMI Jasa menurun dari 50,1 menjadi 48,9

Laurie Bailey 05:16 2025-05-23 UTC+2

Prediksi GBP/USD untuk 23 Mei 2025

Kemarin, pound Inggris ditutup pada level pembukaannya, yang secara visual tampak sebagai konsolidasi di bawah level 1.3433 — level yang sudah berusaha ditembus oleh harga selama sesi Pasifik hari

Laurie Bailey 04:48 2025-05-23 UTC+2

Prediksi EUR/NZD untuk 23 Mei 2025

Pada grafik harian, kuotasi pasangan ini menembus ke atas garis MACD setelah menghabiskan dua minggu di bawahnya. Masuknya osilator Marlin ke wilayah positif mendukung asumsi reversal bullish jangka menengah. Target

Laurie Bailey 04:43 2025-05-23 UTC+2

Sinyal Trading untuk EMAS pada 22-25 Mei 2025: beli di atas $3,281 (21 SMA - 6/8 Murray)

Indikator Eagle menunjukkan sinyal negatif, yang mengisyaratkan bahwa penurunan harga emas dapat berlanjut dalam beberapa hari mendatang. Untuk itu, kita harus memperhatikan zona 3,281; di bawah area ini, prospeknya bisa

Dimitrios Zappas 18:15 2025-05-22 UTC+2

Sinyal Trading untuk BITCOIN pada 22-25 Mei 2025: jual di bawah $111,850 (+2/8 Murray - 200 EMA)

Bitcoin mencapai level tertinggi di atas $111,850 di dekat area +2/8 Murray, yang mewakili zona jenuh beli yang ekstrem. Bitcoin bisa mengalami penurunan tajam dalam beberapa hari mendatang dan mencapai

Dimitrios Zappas 18:12 2025-05-22 UTC+2

Sinyal Trading untuk EUR/USD pada 22-25 Mei 2025: jual di bawah 1,1286 (EMA 200 - SMA 21)

EUR/USD diperdagangkan di sekitar 1,1287 setelah mencoba untuk menembus puncak channel tren menurun. Instrumen ini sekarang berkonsolidasi di sekitar SMA 21, yang menunjukkan bahwa EUR/USD kemungkinan akan melanjutkan penurunannya dalam

Dimitrios Zappas 18:11 2025-05-22 UTC+2

Prediksi untuk EUR/USD pada 22 Mei 2025

Pada hari Rabu, pasangan EUR/USD terus naik dan terkonsolidasi di atas level retracement Fibonacci 50,0% di 1,1320. Akibatnya, euro mungkin terus menguat menuju zona resistance berikutnya di 1,1374–1,1380. Konsolidasi

Samir Klishi 11:51 2025-05-22 UTC+2

Prediksi untuk GBP/USD pada 22 Mei 2025

Pada grafik per jam, pasangan GBP/USD terus naik pada hari Rabu, mengakhiri hari di dekat level 1,3425. Hanya beberapa minggu yang lalu, tidak ada tanda-tanda penjualan dolar lainnya, tetapi optimisme

Samir Klishi 11:45 2025-05-22 UTC+2

Bitcoin: Mencapai Puncak Baru Mungkin Tertunda

Harga Bitcoin sempat melampaui rekor tertinggi baru sebesar $111.000 namun gagal untuk bertahan di atasnya. Token ini, bersama dengan pasar kripto yang lebih luas, terus mendapatkan dukungan dari pelemahan dolar

Pati Gani 09:49 2025-05-22 UTC+2

Analisis Teknikal Pergerakan harga Intraday Indeks Nasdaq 100, Kamis 22 Mei 2025.

Dengan munculnya Divergence antara pergerakan harga indeks Nasdaq 100 yang membentuk Double Top dengan indikator Stochastic Oscillator ditambah konfirmasi dengan pergerakan harganya yang bergerak dibawah WMA (21) memiliki kemiringan yang

Arief Makmur 06:59 2025-05-22 UTC+2
Tidak bisa bicara sekarang?
Tanyakan pertanyaan anda lewat chat.
Widget callback
 

Dear visitor,

Your IP address shows that you are currently located in the USA. If you are a resident of the United States, you are prohibited from using the services of InstaFintech Group including online trading, online transfers, deposit/withdrawal of funds, etc.

If you think you are seeing this message by mistake and your location is not the US, kindly proceed to the website. Otherwise, you must leave the website in order to comply with government restrictions.

Why does your IP address show your location as the USA?

  • - you are using a VPN provided by a hosting company based in the United States;
  • - your IP does not have proper WHOIS records;
  • - an error occurred in the WHOIS geolocation database.

Please confirm whether you are a US resident or not by clicking the relevant button below. If you choose the wrong option, being a US resident, you will not be able to open an account with InstaForex anyway.

We are sorry for any inconvenience caused by this message.