empty
08.06.2023 06:14 PM
Analysis of EUR/USD. June 8th. A corrective wave is expected

This image is no longer relevant

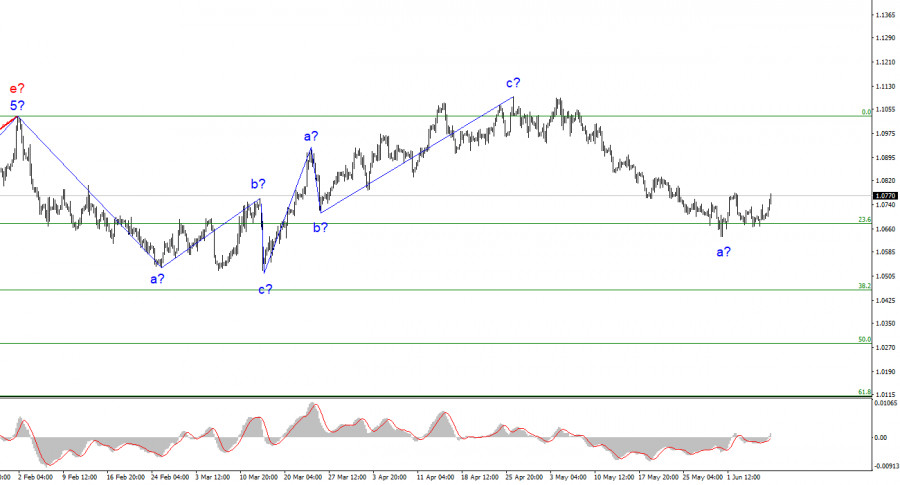
The wave count on the 4-hour chart for the euro/dollar pair continues to be somewhat non-standard but quite understandable. The quotes continue to move away from the previously reached highs, so the three-wave upward structure can be considered complete. The entire ascending trend, which started on March 15, may have a more complex structure, but at the moment, I expect a downward trend to form, which will likely also be a three-wave structure. Over the past period, I have consistently mentioned that I expect the pair to be around the 5th figure, where the upward three-wave movement began.

The peak of the last trend segment was only a few dozen points above the peak of the previous upward segment. Since December last year, the pair's movement can be considered horizontal, which will continue. The presumed wave b, which could have started its formation on May 31, currently looks very unconvincing, but there is still an increase in quotes, so over time, it may shape up as expected.

The exchange rate of the euro/dollar pair increased by 75 basis points on Thursday, which could raise a lot of questions. The most important one is why the euro currency has risen. The only explanation is the formation of an upward wave b, which has been brewing over the past two weeks. The news background did not contribute to the increase in euro quotes. This morning, the GDP report for the first quarter was released in the Eurozone, which marked the end of this period. Three estimates are made for each quarter. If the first two indicated zero growth, the third and final recorded a 0.1% economic decline. The European currency rose throughout the day.

Therefore, the market paid no attention to this report, just as it did not pay attention to the American report on initial jobless claims. Based on this, there can be only one conclusion: the market wants to build a normal corrective wave to resume later the downward trend, which, together with the previous two segments, forms a horizontal segment. If this is true, the decline in quotes will resume in a week or two. The resumption of the decline in the euro currency may coincide with the results of the Federal Reserve or ECB meetings, which will take place in a week and two weeks, respectively. Despite the current increase in the pair, I expect it to form a downward wave with targets located around the 5th figure or lower.

This image is no longer relevant

General conclusions.

Based on the analysis, the formation of the upward trend segment is complete. Therefore, it is advisable to recommend selling, and the pair has significant room for decline. I still consider targets in the range of 1.0500-1.0600 quite realistic, and I advise selling the pair with these targets. From the level of 1.0678, the formation of a corrective wave has started, so I recommend new sales in case of a successful breakout of this level or after an obvious completion of wave b. Within the correction, the pair may reach the 9th figure or thereabouts.

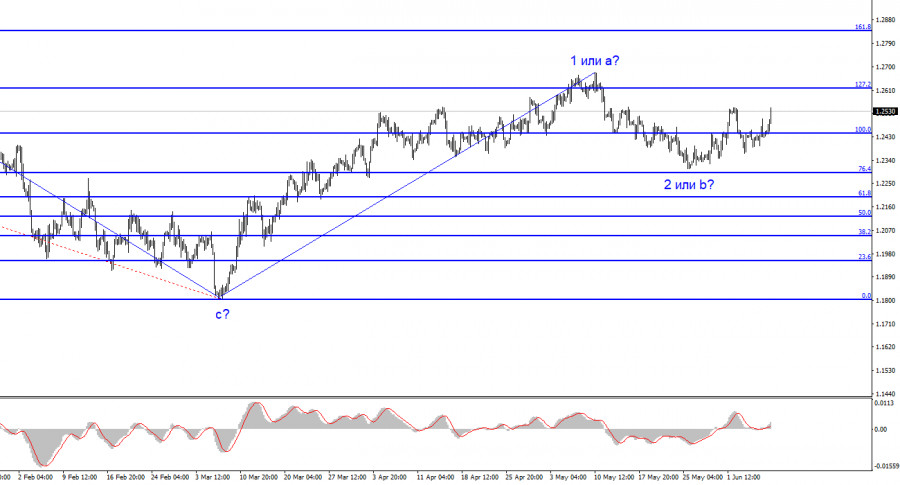
On the higher wave scale, the wave count of the ascending trend has taken on an extensive form but is likely complete. We have seen five upward waves, which most likely constitute the structure of a-b-c-d-e. Then the pair formed two three-wave movements, downwards and upwards. It is likely in the process of forming another descending three-wave structure.

Chin Zhao,
InstaForex के विश्लेषणात्मक विशेषज्ञ
© 2007-2025
समय सीमा चुनें
5
मिनट
15
मिनट
30
मिनट
1
घंटा
4
घंटे
1
दिन
1
सप्ताह
Earn on cryptocurrency rate changes with InstaForex
Download MetaTrader 4 and open your first trade
  • Grand Choice
    Contest by
    InstaForex
    InstaForex always strives to help you
    fulfill your biggest dreams.
    कॉन्टेस्ट में हिस्सा लें

अनुशंसित लेख

20 मई, 2025 को GBP/USD का विश्लेषण

GBP/USD के लिए वेव पैटर्न डोनाल्ड ट्रम्प के कारण एक बुलिश इम्पल्सिव वेव स्ट्रक्चर के बनने का संकेत देता रहा है। यह वेव पिक्चर लगभग EUR/USD जोड़ी जैसा ही है।

Chin Zhao 13:36 2025-05-21 UTC+2

EUR/USD, USD/JPY, GBP/JPY, USD/CAD, NZD/USD और गोल्ड के लिए सरल वेव विश्लेषण पर आधारित साप्ताहिक पूर्वानुमान – 21 अप्रैल

EUR/USD विश्लेषण: फरवरी से, EUR/USD एक ऊपर की ओर वेव बना रहा है, जिसकी अंतिम अवस्था (C) वर्तमान में चल रही है। हाल ही में इस जोड़ी ने एक मजबूत

Isabel Clark 11:13 2025-04-21 UTC+2

EUR/USD, USD/JPY, GBP/JPY, USD/CAD, #Bitcoin, और #Ripple के लिए सरलीकृत तरंग विश्लेषण पर आधारित साप्ताहिक पूर्वानुमान - 31 मार्च

आने वाले दिनों में यूरो विनिमय दर में गिरावट का दौर पूरा होने की संभावना है, जो संभावित रूप से गणना किए गए समर्थन क्षेत्र की निचली सीमा तक पहुंच

Isabel Clark 19:17 2025-03-31 UTC+2

20 मार्च 2025 को EUR/USD का विश्लेषण

EUR/USD के 4-घंटे चार्ट पर वेव संरचना एक अधिक जटिल रूप में बदलने के जोखिम में है। 25 सितंबर को एक नया डाउनट्रेंड संरचना बननी शुरू हुई, जो एक इम्पल्स

Chin Zhao 08:05 2025-03-21 UTC+2

10 मार्च को EUR/USD, USD/JPY, GBP/JPY, USD/CAD, GOLD और बिटकॉइन के लिए सरलीकृत तरंग विश्लेषण पर आधारित साप्ताहिक पूर्वानुमान

विश्लेषण: फरवरी की शुरुआत से ही, यूरो एक ऊपर की ओर टेढ़ी-मेढ़ी लहर बना रहा है, जो एक नए तेजी के रुझान की शुरुआत को दर्शाता है। यह जोड़ी साप्ताहिक

Isabel Clark 10:15 2025-03-10 UTC+2

10 मार्च को GBP/USD, AUD/USD, USD/CHF, EUR/JPY, Ethereum, और Litecoin के लिए साप्ताहिक पूर्वानुमान बेससिम्प्लीफाइड वेव विश्लेषण

विश्लेषण: 13 जनवरी को शुरू हुई ऊपर की लहर अभी भी अधूरी है, जो प्रमुख वैश्विक अपट्रेंड का एक नया खंड बनाती है। यह जोड़ी वर्तमान में समर्थन और प्रतिरोध

Isabel Clark 10:12 2025-03-10 UTC+2

सरलीकृत तरंग विश्लेषण पर आधारित साप्ताहिक पूर्वानुमान: GBP/USD, AUD/USD, USD/CHF, EUR/JPY, एथेरियम, लिटकोइन - 24 फ़रवरी

पिछले छह महीनों में, GBP/USD में गिरावट का रुख रहा है। जनवरी के मध्य से, कीमत एक मजबूत समर्थन क्षेत्र से उलटफेर की संभावना के साथ एक काउंटर-वेव बना रही

Isabel Clark 18:23 2025-02-24 UTC+2

GBP/USD विश्लेषण – 11 फरवरी: बाजार बैली से बहुत उम्मीदें लगाए हुए है

GBP/USD विश्लेषण – 11 फरवरी: GBP/USD की लहर संरचना कुछ हद तक अस्पष्ट है लेकिन सामान्यत: समझने योग्य है। उच्च संभावना है कि एक दीर्घकालिक मंदी प्रवृत्ति का खंड अभी

Chin Zhao 06:33 2025-02-12 UTC+2

GBP/USD, AUD/USD, USD/CHF, EUR/JPY, यूएस डॉलर इंडेक्स और एथेरियम के लिए सरलीकृत तरंग विश्लेषण पर आधारित साप्ताहिक पूर्वानुमान – 3 फरवरी

ब्रिटिश पाउंड के लिए प्रमुख मंदी की लहर, जो पिछले साल अगस्त में शुरू हुई थी, दो सप्ताह पहले शुरू हुए सुधारात्मक, बदलते फ्लैट पैटर्न के माध्यम से विकसित होना

Isabel Clark 18:00 2025-02-03 UTC+2

EUR/USD, USD/JPY, GBP/JPY, USD/CAD, NZD/USD, और बिटकॉइन के लिए सरलीकृत तरंग विश्लेषण पर आधारित साप्ताहिक पूर्वानुमान – 3 फरवरी

विश्लेषण: पिछले साल अक्टूबर से, यूरो की कीमत में उतार-चढ़ाव की लहर चल रही है। साल की शुरुआत से ही एक काउंटर-करेक्शन बन रहा है, जो एक विस्तारित फ्लैट पैटर्न

Isabel Clark 17:54 2025-02-03 UTC+2
अभी बात नहीं कर सकते?
अपना प्रश्न पूछें बातचीत.
Widget callback
 

Dear visitor,

Your IP address shows that you are currently located in the USA. If you are a resident of the United States, you are prohibited from using the services of InstaFintech Group including online trading, online transfers, deposit/withdrawal of funds, etc.

If you think you are seeing this message by mistake and your location is not the US, kindly proceed to the website. Otherwise, you must leave the website in order to comply with government restrictions.

Why does your IP address show your location as the USA?

  • - you are using a VPN provided by a hosting company based in the United States;
  • - your IP does not have proper WHOIS records;
  • - an error occurred in the WHOIS geolocation database.

Please confirm whether you are a US resident or not by clicking the relevant button below. If you choose the wrong option, being a US resident, you will not be able to open an account with InstaForex anyway.

We are sorry for any inconvenience caused by this message.