empty
09.06.2023 07:42 PM
Technical analysis of EUR/USD for June 09, 2023

This image is no longer relevant

Overview :

The US Dollar has been losing ground against some of its major counterparts, such as the Euro and British Pound. In response, retail traders have been responding by decreasing downside exposure in the US Dollar currency.

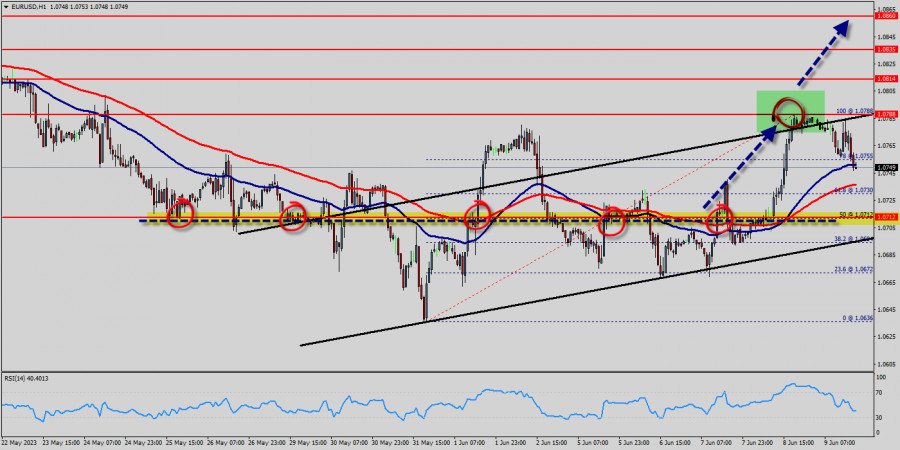
The EUR/USD pair will continue rising from the level of 1.0712 today. So, the support is found at the level of 1.0712, which represents the 50% Fibonacci retracement level in the H1 time frame. Since the trend is above the 50% Fibonacci level, the market is still in an uptrend.

With that in mind, is there more room for the Euro to rally?

On the daily chart, the EUR/USD pairis showing signs of an increasingly bullish technical bias. Prices have broken under the rising trendline from September. Meanwhile, a bullish between the 50- and 100-day Simple Moving Averages is present (SMA). Currently, prices are idling just under the 1.0700 and 1.0715 inflection zone. Key support below is the 50% Fibonacci retracement level at 1.0712. In the event of a turn higher, the moving averages may hold as key resistance, maintaining the upside focus.

The EUR/USD pair has faced strong support at the level of 1.0712 because resistance became support. So, the strong resistance has been already faced at the level of 1.0788 and the pair is likely to try to approach it in order to test it again.

The level of 1.0712 represents a weekly pivot point for that it is acting as minor support this week. Furthermore, the EUR/USD pair is continuing to trade in a bullish trend from the new support level of 1.0712.

Currently, the price is in a bullish channel. According to the previous events, we expect the EUR/USD pair to move between 1.0712 and 1.0814.

Also, it should be noticed that the double top is set at 1.0788. Additionally, the RSI is still signaling that the trend is upward as it remains strong above the moving average (100).

This suggests the pair will probably go up in coming hours. Accordingly, the market is likely to show signs of a bullish trend. In other words, buy orders are recommended above 1.0712 with the first target at the level of 1.0788 . If the trend is be able to break the double top at the level of 1.0788, then the market will continue rising towards the weekly resistance 1 at 1.0814.

However, the price spot of 1.0814 remains a significant resistance zone. Thus, the trend will probably be rebounded again from the double top as long as the level of 1.0814 is not breached. The market is still in an uptrend. We still prefer the bullish scenario.

Pilih carta masa
5
min
15
min
30
min
1
jam
4
jam
1
hari
1
minggu
Jana pendapatan melalui perubahan kadar mata wang kripto dengan InstaForex.
Muat turun MetaTrader 4 dan buka dagangan pertama anda.
  • Grand Choice
    Contest by
    InstaForex
    InstaForex always strives to help you
    fulfill your biggest dreams.
    SERTAI PERADUAN

Artikel yang dicadangkan

XAU/USD. Analisis dan Ramalan

Emas kini sedang berpegang pada kerugian harian. Secara keseluruhan, sentimen positif di pasaran saham sedang melemahkan permintaan untuk logam berharga ini. Walau bagaimanapun, gabungan beberapa faktor sedang menghalang pasaran menurun

Irina Yanina 12:18 2025-06-16 UTC+2

GBP/USD – 16 Jun: Tahap 1.3527 Kekal Dikuasai oleh Kenaikan harga

Pada carta mengikut jam, pasangan GBP/USD pada hari Jumaat melantun semula dua kali dari tahap penarikan semula Fibonacci 127.2% di 1.3527 dan meningkat menuju zon rintangan 1.3611–1.3633. Walau bagaimanapun, sebelum

Samir Klishi 10:27 2025-06-16 UTC+2

Analisis Teknikal Pergerakan Harga Harian USD/IDR Pasangan Mata Wang Eksotik, Isnin 16 Jun 2025.

Dengan kemunculan corak Bullish 123 di tengah-tengah keadaan penyusutan pada pasangan mata wang eksotik ini, yang telah disahkan oleh pergerakan harga USD/IDR yang bergerak dalam saluran Equisidant dengan cerun menurun

Arief Makmur 07:16 2025-06-16 UTC+2

Analisis Teknikal Pergerakan Harga Harian Instrumen Komoditi Minyak Mentah, Isnin 16 Jun 2025.

Pada carta 4 jam instrumen komoditi Minyak Mentah, terdapat kemunculan Perbezaan antara pergerakan harga #CL dan penunjuk Pengayun Stochastic , yang menunjukkan bahawa dalam masa terdekat terdapat potensi untuk pembetulan

Arief Makmur 07:16 2025-06-16 UTC+2

Isyarat Dagangan untuk EUR/USD bagi 13-19 Jun, 2025: beli di atas 1.1500 (21 SMA - 7/8 Murray)

Di bawah senario yang bertentangan, jika euro jatuh di bawah 1.1490, kemungkinan besar ia akan mencecah 200 EMA, yang terletak pada 1.1340 dan bertepatan dengan bahagian bawah saluran aliran menaik

Dimitrios Zappas 14:14 2025-06-13 UTC+2

Isyarat Dagangan EMAS untuk 13-19 Jun 2025: jual di bawah 3,343 (21 SMA - 8/8 Murray)

Emas telah meninggalkan jurang pada 3,282 dan satu lagi sekitar 3,181. Jadi, jika harga jatuh di bawah paras psikologi 3,300, kita boleh menjangkakan ia jatuh untuk menutup paras harga

Dimitrios Zappas 14:12 2025-06-13 UTC+2

Ramalan untuk EUR/USD pada 13 Jun, 2025

Pada hari Khamis, pasangan EUR/USD meneruskan pergerakan kenaikannya dan berjaya membuat pengukuhan di atas paras 100.0% anjakan semula Fibonacci pada 1.1574. Namun, sepanjang malam, berlaku pembalikan mendadak memihak kepada dolar

Samir Klishi 11:52 2025-06-13 UTC+2

Ramalan untuk GBP/USD pada 13 Jun, 2025

Pada carta setiap jam, pasangan GBP/USD pada hari Khamis melantun semula dari tahap 1.3520, melonjak ke zon rintangan 1.3611–1.3620, dua kali melantun daripadanya, dan kemudian jatuh semula ke tahap anjakan

Samir Klishi 11:49 2025-06-13 UTC+2

EUR/USD. 12 Jun. Tekanan Terbaharu ke Atas Dolar

Selamat sejahtera, para pedagang yang dihormati! Pada hari Rabu, pasangan EUR/USD meneruskan pergerakan menaik setelah melantun semula dari zon sokongan 1.1374–1.1380. Ia berjaya disokong di atas tahap pemulihan semula Fibonacci

Samir Klishi 10:15 2025-06-12 UTC+2

GBP/USD. 12 Jun. Ekonomi Britain Melemah

Selamat sejahtera, para pedagang yang dihormati! Pada carta sejam, pada hari Rabu, pasangan GBP/USD telah berbalik memihak kepada pound Britain dan membuat pengukuhan di atas paras anjakan semula Fibonacci 161.8%

Samir Klishi 10:15 2025-06-12 UTC+2
Tidak boleh bertanya sekarang?
Tanya soalan anda di Ruangan bersembang.
Panggilan semula Widget
 

Dear visitor,

Your IP address shows that you are currently located in the USA. If you are a resident of the United States, you are prohibited from using the services of InstaFintech Group including online trading, online transfers, deposit/withdrawal of funds, etc.

If you think you are seeing this message by mistake and your location is not the US, kindly proceed to the website. Otherwise, you must leave the website in order to comply with government restrictions.

Why does your IP address show your location as the USA?

  • - you are using a VPN provided by a hosting company based in the United States;
  • - your IP does not have proper WHOIS records;
  • - an error occurred in the WHOIS geolocation database.

Please confirm whether you are a US resident or not by clicking the relevant button below. If you choose the wrong option, being a US resident, you will not be able to open an account with InstaForex anyway.

We are sorry for any inconvenience caused by this message.