empty
01.06.2023 03:23 PM
EUR/USD: technical analysis on June 1. EUR braced for lower decline

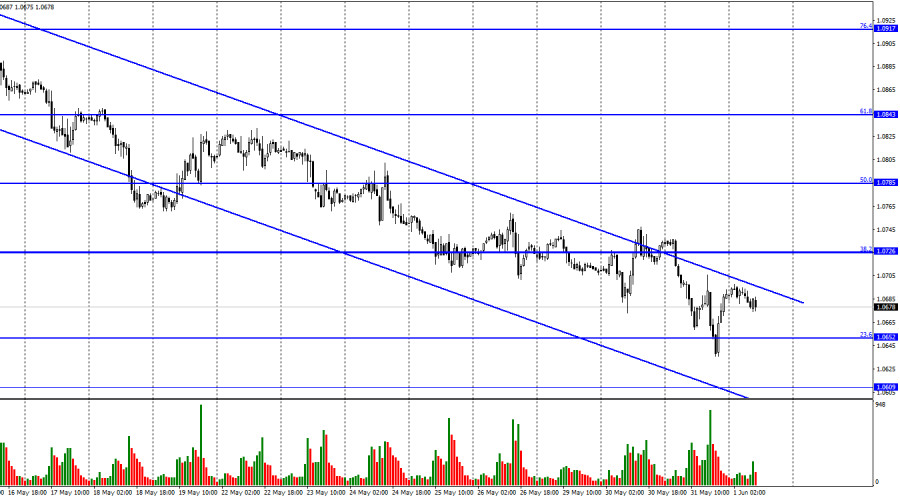
Hi, dear traders! On Wednesday, EUR/USD fell to 1.0652, the 23.6% Fibonacci level. The rebound from this level allowed the currency pair to show a slight increase towards the upper border of the downtrend corridor. However, at the moment, the pair has again turned in favor of the US currency and is preparing to resume its fall towards 1.0609 and possibly even lower. If the instrument settles above the corridor, it will allow traders to count on some growth after a monthly fall.

This image is no longer relevant

The information background of yesterday was interesting for traders. In particular, the number of open vacancies in the US JOLTS report turned out to be much better than the market consensus. Partly thanks to this data, the US dollar recovered again. However, yesterday should already be forgotten, since today the economic calendar is jam-packed with a great number of economic reports. Just below are listed all the events of the day that will matter to market sentiment. Particular attention should be paid to the report on inflation in the European Union. It is expected that the consumer price index will continue to slow down and will be 6.3-6.5% y/y in May. These forecasts are confirmed by inflation data from other EU countries, which was released 1-2 days ago. Inflation has declined in almost all countries, so we should expect a fall in the headline inflation in the EU.

In my opinion, if the actual EU CPI matches the forecast or exceeds it (that is, inflation will fall lower), this will create pressure on the euro currency, since in this case, the ECB may begin to send dovish signals. If inflation falls quickly and steadily, then there is less reason to continue tightening monetary policy. It is obvious that inflation is still far from the target level, so the ECB will not stop raising the rate, but the expectations of the market itself are important here. If investors sense that in the near future, the regulator may send a message about a pause in rate hikes, it will be bearish for the euro.

This image is no longer relevant

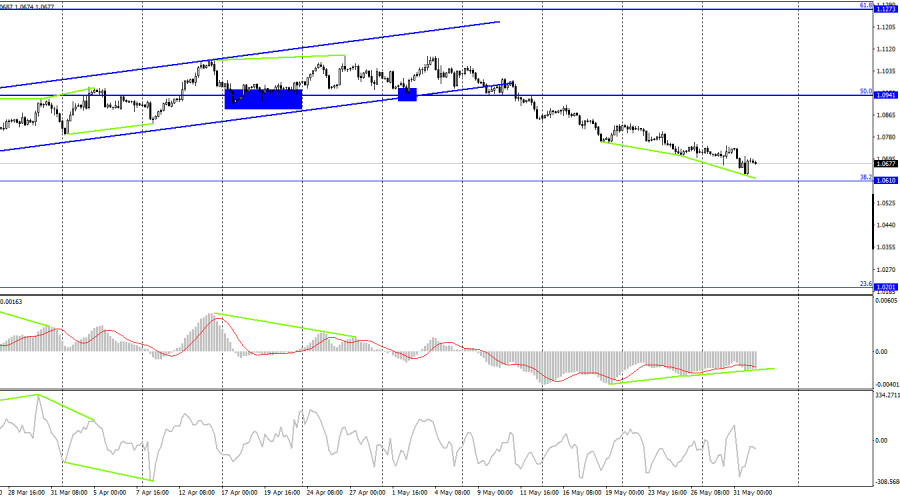
On the 4-hour chart, EUR/USD is extending its fall towards the Fibonacci 38.2% correction level at 1.0610. The imminent bullish divergence at the MACD indicator allows us to expect a slight increase, but it has not been confirmed yet. The rebound of the price from the level of 1.0610 will work in favor of the EU currency and encourage some growth. Closing below 1.0610 will increase the probability of a further decline towards 1.0201, the next Fibonacci level of 23.6%.

Commitments of Traders (COT)

This image is no longer relevant

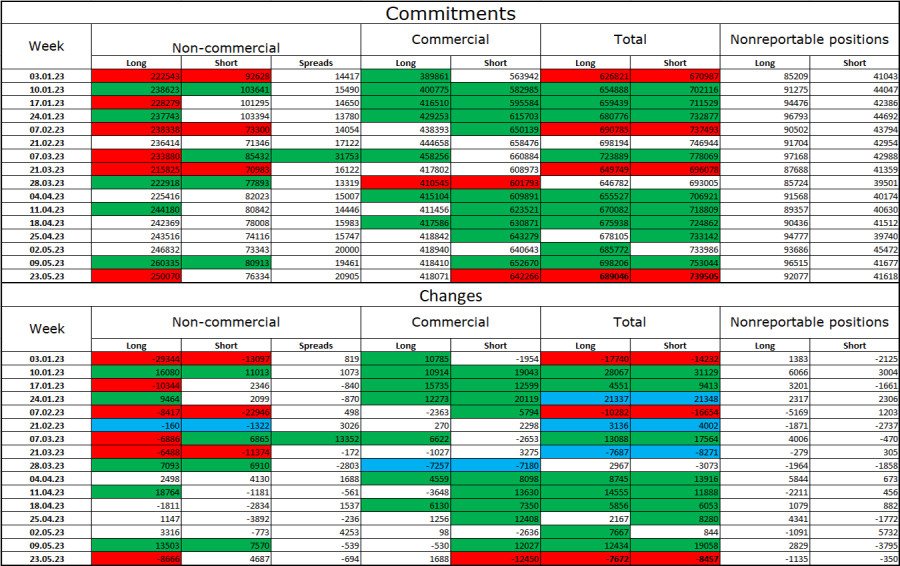
In the last reporting week, speculators closed 8,666 long contracts and opened 4,687 short contracts. The overall market sentiment remains bullish and continues to intensify. The total number of long contracts held by speculators is now 250,000, while short contracts are only 76,000. All in all, clear-cut bullish sentiment is still valid, but I think that the situation will gradually change in the near future. The European currency has already begun to weaken. A large deal of open long contracts suggests that the buyers may decide to close them soon (or already have, as the latest COT report suggests). The bias towards the bulls is too strong at the moment. I believe that the current figures indicate a fall in the euro in the near future. Another thing is that a greater number of long contracts are in the hands of the Commercial group. This means that they exert a greater influence on the instrument's trajectory.

Economic calendar for US and EU

EU: manufacturing PMI (08-00 UTC)

EU: CPI (09-00 UTC)

EU: unemployment rate (09-00 UTC)

EU: ECB President Christine Lagarde speaks (09-30 UTC)

EU: ECB minutes of last monetary policy meeting (11-30 UTC)

US: ADP non-farm employment report (12-15 UTC)

US: initial unemployment claims (12-30 UTC)

US: ISM manufacturing PMI (14-00 UTC)

On June 1, the economic calendar is loaded with macroeconomic data and events of various importance. The information background matters a lot to market sentiment today.

Forecast for EUR/USD and trading tips

We can open more sell positions on EUR/USD after the price rebounds from the upper line of the trend channel or from about that level with the downward target at 1.0690 on the 1-hour chart. I would advise opening long positions not until the price closes above the descending trend channel with upward targets at 1.0726 and 1.0785 on the 1-hour chart.

Pilih carta masa
5
min
15
min
30
min
1
jam
4
jam
1
hari
1
minggu
Jana pendapatan melalui perubahan kadar mata wang kripto dengan InstaForex.
Muat turun MetaTrader 4 dan buka dagangan pertama anda.
  • Grand Choice
    Contest by
    InstaForex
    InstaForex always strives to help you
    fulfill your biggest dreams.
    SERTAI PERADUAN

Artikel yang dicadangkan

Ramalan untuk EUR/USD pada 13 Jun, 2025

Pada hari Khamis, pasangan EUR/USD meneruskan pergerakan kenaikannya dan berjaya membuat pengukuhan di atas paras 100.0% anjakan semula Fibonacci pada 1.1574. Namun, sepanjang malam, berlaku pembalikan mendadak memihak kepada dolar

Samir Klishi 11:52 2025-06-13 UTC+2

Ramalan untuk GBP/USD pada 13 Jun, 2025

Pada carta setiap jam, pasangan GBP/USD pada hari Khamis melantun semula dari tahap 1.3520, melonjak ke zon rintangan 1.3611–1.3620, dua kali melantun daripadanya, dan kemudian jatuh semula ke tahap anjakan

Samir Klishi 11:49 2025-06-13 UTC+2

EUR/USD. 12 Jun. Tekanan Terbaharu ke Atas Dolar

Selamat sejahtera, para pedagang yang dihormati! Pada hari Rabu, pasangan EUR/USD meneruskan pergerakan menaik setelah melantun semula dari zon sokongan 1.1374–1.1380. Ia berjaya disokong di atas tahap pemulihan semula Fibonacci

Samir Klishi 10:15 2025-06-12 UTC+2

GBP/USD. 12 Jun. Ekonomi Britain Melemah

Selamat sejahtera, para pedagang yang dihormati! Pada carta sejam, pada hari Rabu, pasangan GBP/USD telah berbalik memihak kepada pound Britain dan membuat pengukuhan di atas paras anjakan semula Fibonacci 161.8%

Samir Klishi 10:15 2025-06-12 UTC+2

Analisis Teknikal Pergerakan Harga Harian Instrumen Komoditi Minyak Mentah, Khamis 12 Jun 2025.

Jika kita melihat carta harian bagi instrumen komoditi Minyak Mentah, terdapat Perbezaan di antara pergerakan harga #CL dan penunjuk Pengayun Stochastic, yang menunjukkan kemungkinan #CL akan mengalami pembetulan penyusutan dalam

Arief Makmur 08:10 2025-06-12 UTC+2

Analisis Teknikal Pergerakan Harga Harian Indeks Nasdaq 100, Khamis 12 Jun 2025.

Pada carta 4 jam indeks Nasdaq 100, terdapat perbezaan antara pergerakan harga dan penunjuk Pengayun Stochastic, terutamanya dengan pengesahan pergerakan harga semasa #NDX yang bergerak di bawah EMA (21), maka

Arief Makmur 08:10 2025-06-12 UTC+2

Isyarat Dagangan untuk EUR/USD bagi 12-19 Jun, 2025: jual di bawah 1.1500 (21 SMA - 8/8 Murray)

Jika harga euro jatuh di bawah 1.1500 dalam beberapa jam akan datang, ini boleh dilihat sebagai peluang untuk menjual. Dari sudut teknikal, ia kelihatan terlebih belian pada carta

Dimitrios Zappas 05:33 2025-06-12 UTC+2

Isyarat Dagangan EMAS (XAU/USD) untuk 12-19 Jun 2025: jual di bawah $3,386 (21 SMA - 7/8 Murray)

Aliran XAU/USD kekal dalam fasa kenaikan selagi harga terus membuat pengukuhan di atas paras 3,331. Oleh demikian, adalah wajar untuk membeli emas selagi harga terus membuat pengukuhan di atas paras

Dimitrios Zappas 05:32 2025-06-12 UTC+2

Ramalan EUR/USD untuk 12 Jun 2025

Data inflasi A.S. yang dikeluarkan pada hari Rabu telah menggoyahkan pasaran: indeks dolar menurun sebanyak 0.47%, minyak WTI melonjak sebanyak 5.54%, emas meningkat sebanyak 1.27%, dan hasil Perbendaharaan A.S

Laurie Bailey 04:40 2025-06-12 UTC+2

Ramalan GBP/USD untuk 12 Jun 2025

Pada hari Rabu, pound British berjaya mengelakkan penurunan di bawah paras sokongan teknikal, lalu berbalik naik dari paras tersebut. Harga membuat lantunan dari garisan penunjuk MACD pada carta harian, manakala

Laurie Bailey 04:40 2025-06-12 UTC+2
Tidak boleh bertanya sekarang?
Tanya soalan anda di Ruangan bersembang.
Panggilan semula Widget
 

Dear visitor,

Your IP address shows that you are currently located in the USA. If you are a resident of the United States, you are prohibited from using the services of InstaFintech Group including online trading, online transfers, deposit/withdrawal of funds, etc.

If you think you are seeing this message by mistake and your location is not the US, kindly proceed to the website. Otherwise, you must leave the website in order to comply with government restrictions.

Why does your IP address show your location as the USA?

  • - you are using a VPN provided by a hosting company based in the United States;
  • - your IP does not have proper WHOIS records;
  • - an error occurred in the WHOIS geolocation database.

Please confirm whether you are a US resident or not by clicking the relevant button below. If you choose the wrong option, being a US resident, you will not be able to open an account with InstaForex anyway.

We are sorry for any inconvenience caused by this message.