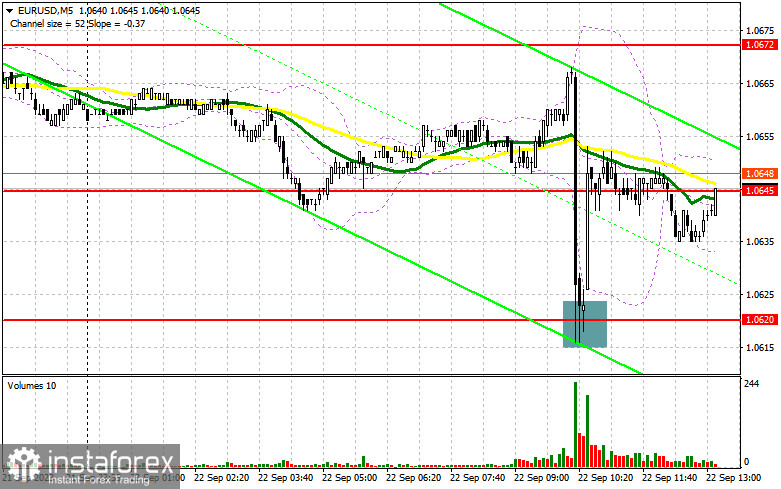
In my morning forecast, I drew attention to the level of 1.0620 and recommended making trading decisions based on it. Let's look at the 5-minute chart and analyze what happened there. The drop and the formation of a false breakout at 1.10620 became a reason to buy the euro, increasing the pair by more than 30 points back to the middle of the sideways channel. The technical picture remained unchanged for the second half of the day.
To open long positions on EUR/USD, the following is required:
The euro predictably reacted to the decline in the PMI indices of Eurozone countries, which is another proof of the growing problems in the European economy due to high-interest rates. However, the bulls showed themselves after the pair moved down and bought up the monthly lows, maintaining equilibrium for the second half of the day. Data on the Manufacturing Purchasing Managers' Index, the Services Purchasing Managers' Index, and the Composite PMI Index for the United States will also be published during the American session. Poor indicators may keep demand for the euro and allow for a correction at the end of the week. Speeches by FOMC members Lisa D. Cook and Neel Kashkari are mandatory to monitor. I still plan to act against the bearish trend only after forming a false breakout near the nearest support at 1.0620. Only this will lead to a good entry point for long positions, with the expectation of an upward correction in the pair towards 1.0645 by the end of the week. A breakthrough and testing of this range from top to bottom in the case of weak US macroeconomic indicators will revive demand for the euro, providing an opportunity for a leap to resistance levels at 1.0672 and 1.0704. The ultimate goal will be the area of 1.0734, where I will take profit. In the event of another decline in EUR/USD and the absence of activity at 1.0620, the bearish trend will continue to develop. In this case, only the formation of a false breakout around 1.0590 will signal an entry into the market. I will open long positions from 1.0554 with the aim of an upward correction of 30-35 pips within the day.
To open short positions on EUR/USD, the following is required:
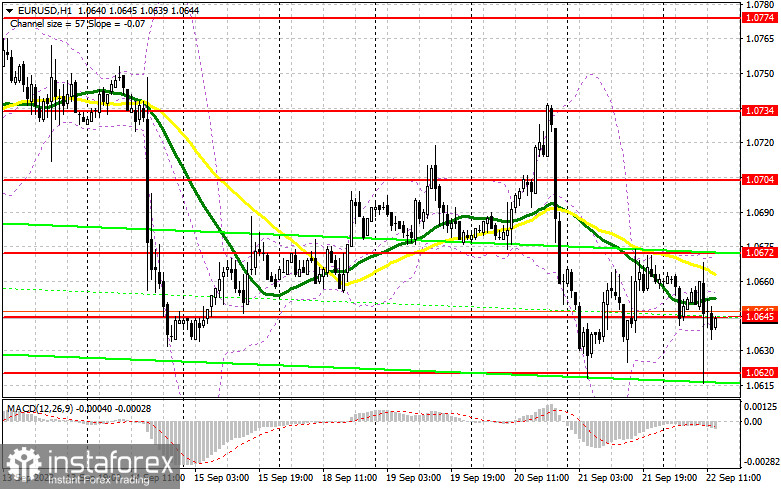
It is unsurprising that after weak Eurozone statistics, sellers continued to control the market. Now, for the development of a new bearish scenario, they need good US statistics and protection of the nearest resistance at 1.0645, where, just above, moving averages are playing on the sellers' side. A false breakout at this level will lead to a good entry point for selling with a downward movement towards 1.0620. Only after a breakthrough and consolidation below this range, as well as a reverse test from bottom to top, do I expect to receive another selling signal to reach 1.0590 - a new monthly low, where I expect the appearance of larger buyers. The ultimate goal will be the area of 1.0554, where I will take profit. In the event of an upward movement of EUR/USD during the European session and the absence of bears at 1.0645, buyers will have a good chance of recovery at the end of the week. In this scenario, I will postpone short positions until the new resistance at 1.0672. You can also sell there, but only after an unsuccessful consolidation. I will open short positions immediately on the rebound from the maximum of 1.0704 with the aim of a downward correction of 30-35 pips.

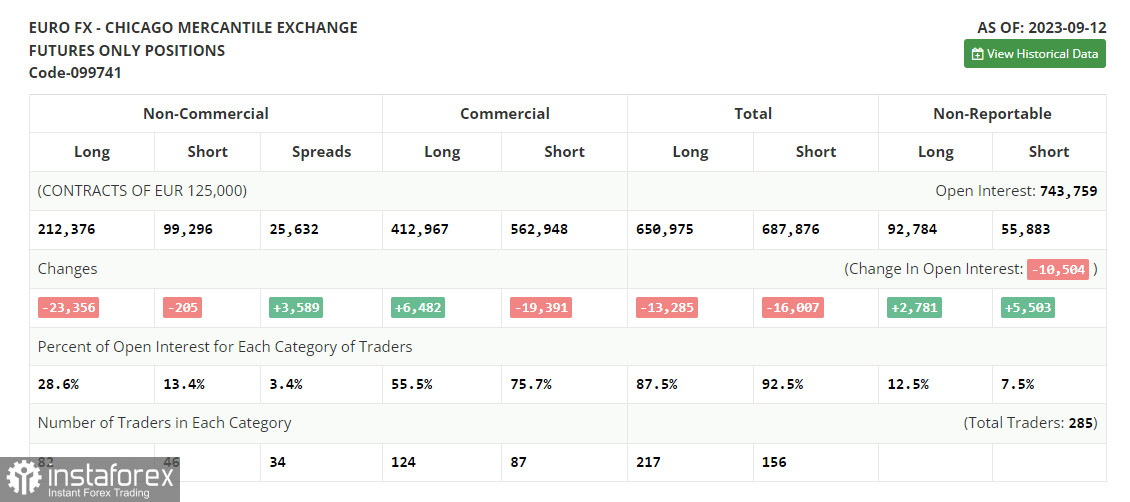
In the COT report (Commitment of Traders) for September 12, there was a sharp reduction in long positions and only a slight decrease in short positions. Very serious negative changes in activity in the Eurozone and a revision of GDP for the second quarter in the worst direction did not stop the European Central Bank from raising interest rates again. As you understand, this will not lead to anything good soon, which caused such a sharp decline in the European currency. In the near future, we will have a meeting of the Federal Reserve, and if the committee also decides to raise rates, the euro will fall even more against the dollar, so I advise against rushing to buy in the current conditions. According to the COT report, long non-commercial positions decreased by 23,356 to 212,376, while short non-commercial positions decreased by only 205 to 99,296. As a result, the spread between long and short positions increased by 6,589. The closing price decreased to 1.0736 from 1.0728, indicating a bearish market.

Indicator Signals:
Moving Averages
Trading is taking place below the 30 and 50-day moving averages, indicating further decline in the pair.
Note: The author considers the period and prices of moving averages on the hourly chart (H1), which differs from the general definition of classic daily moving averages on the daily chart (D1).
Bollinger Bands
In the case of an uptrend, the upper boundary of the indicator at around 1.0672 will act as resistance.
Description of Indicators:
• Moving average (determines the current trend by smoothing out volatility and noise). Period 50. Marked in yellow on the chart.
• Moving average (determines the current trend by smoothing out volatility and noise). Period 30. Marked in green on the chart.
• MACD indicator (Moving Average Convergence/Divergence — convergence/divergence of moving averages). Fast EMA period 12. Slow EMA period 26. SMA period 9.
• Bollinger Bands. Period 20.
• Non-commercial traders - speculators, such as individual traders, hedge funds, and large institutions using the futures market for speculative purposes and meeting specific requirements.
• Long non-commercial positions represent the total long open positions of non-commercial traders.
• Short non-commercial positions represent the total short open positions of non-commercial traders.
• The total non-commercial net position is the difference between non-commercial traders' short and long positions.