empty
сформирован 23.06 в 16:00:58 (UTC+0)
сила сигнала 1 из 5
Медвежий вымпел USDCAD M5

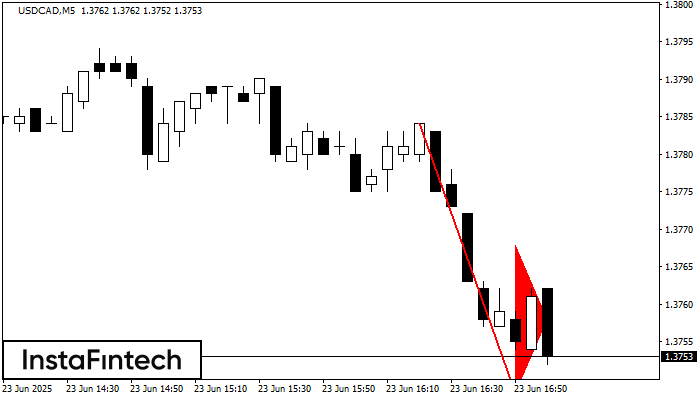
На графике USDCAD M5 сформировалась фигура «Медвежий вымпел», которая сигнализирует о возможном продолжении тренда. Характеристика: основание фигуры имеет координаты 1.3748; проекция высоты флагштока равна 36 пунктов. В случае если цена преодолеет основание фигуры 1.3748, то ожидается продолжение нисходящего тренда на уровень 1.3733 пунктов.

Таймфреймы М5 и М15 могут иметь больше ложных точек входа.

Шунингдек кўринг

Фигура
  • Все
  • Вымпел
  • Голова и плечи
  • Двойная вершина
  • Прямоугольник
  • Треугольник
  • Тройная вершина
  • Флаг
Инструмент
  • Все
  • #AAPL
  • #AMZN
  • #Bitcoin
  • #EBAY
  • #FB
  • #GOOG
  • #INTC
  • #KO
  • #MA
  • #MCD
  • #MSFT
  • #NTDOY
  • #PEP
  • #TSLA
  • #TWTR
  • AUDCAD
  • AUDCHF
  • AUDJPY
  • AUDUSD
  • EURCAD
  • EURCHF
  • EURGBP
  • EURJPY
  • EURNZD
  • EURRUB
  • EURUSD
  • GBPAUD
  • GBPCHF
  • GBPJPY
  • GBPUSD
  • GOLD
  • NZDCAD
  • NZDCHF
  • NZDJPY
  • NZDUSD
  • SILVER
  • USDCAD
  • USDCHF
  • USDJPY
  • USDRUB
Таймфрейм
  • Все
  • M5
  • M15
  • M30
  • H1
  • D1
Тренд
  • Все
  • Покупка
  • Продажа
Сила сигнала
  • Все
  • 1
  • 2
  • 3
  • 4
  • 5
Bearish Rectangle
was formed on 18.08 at 20:00:36 (UTC+0)
signal strength 1 of 5
Bearish Rectangle NZDJPY M5

According to the chart of M5, NZDJPY formed the Bearish Rectangle. The pattern indicates a trend continuation. The upper border is 87.50, the lower border is 87.41. The signal means

The M5 and M15 time frames may have more false entry points.

Open chart in a new window
Double Bottom
was formed on 18.08 at 19:35:22 (UTC+0)
signal strength 1 of 5
Double Bottom GBPJPY M5

The Double Bottom pattern has been formed on GBPJPY M5; the upper boundary is 200.24; the lower boundary is 199.52. The width of the pattern is 71 points. In case

The M5 and M15 time frames may have more false entry points.

Open chart in a new window
Triple Bottom
was formed on 18.08 at 19:00:30 (UTC+0)
signal strength 1 of 5
Triple Bottom AUDJPY M5

The Triple Bottom pattern has formed on the chart of AUDJPY M5. Features of the pattern: The lower line of the pattern has coordinates 95.92 with the upper limit 95.92/95.90

The M5 and M15 time frames may have more false entry points.

Open chart in a new window
Ҳозир телефон орқали гаплаша олмайсизми?
Саволингизни беринг чатда.
Обратный звонок
 

Dear visitor,

Your IP address shows that you are currently located in the USA. If you are a resident of the United States, you are prohibited from using the services of InstaFintech Group including online trading, online transfers, deposit/withdrawal of funds, etc.

If you think you are seeing this message by mistake and your location is not the US, kindly proceed to the website. Otherwise, you must leave the website in order to comply with government restrictions.

Why does your IP address show your location as the USA?

  • - you are using a VPN provided by a hosting company based in the United States;
  • - your IP does not have proper WHOIS records;
  • - an error occurred in the WHOIS geolocation database.

Please confirm whether you are a US resident or not by clicking the relevant button below. If you choose the wrong option, being a US resident, you will not be able to open an account with InstaForex anyway.

We are sorry for any inconvenience caused by this message.