empty
28.10.2021 10:15 AM
Trading plan for starters of EUR/USD and GBP/USD on October 28, 2021

Here are the details of the economic calendar for October 27:

Yesterday, durable goods data were published, where their volume decreased by -0.4% in the period of September. This is not the best result, but an even stronger reduction of -1.1% was expected. As a result, the US dollar was still under pressure.

Analysis of trading charts from October 27:

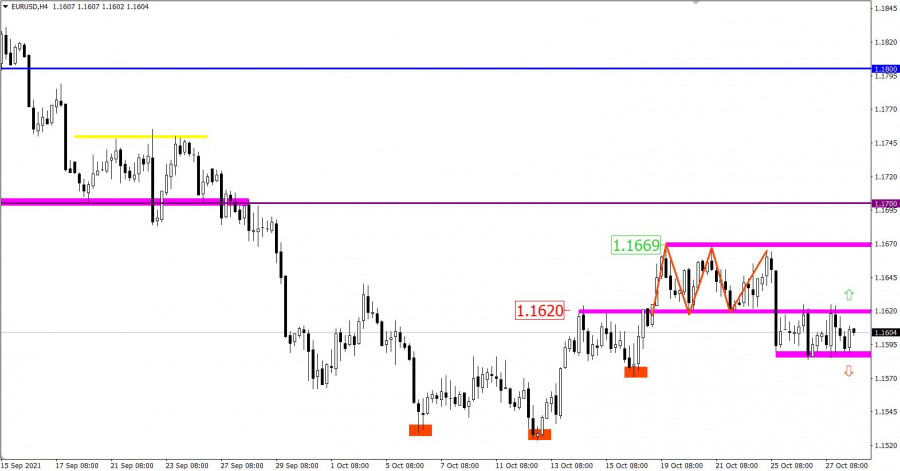
The EUR/USD pair formed a side-channel again in the range of 1.1585/1.1625 after a short decline. It is assumed that the stagnation is associated with the upcoming ECB meeting, which leads to the accumulation of trade forces. As a result, there will be an outgoing impulse with a sharp increase in speculative interest.

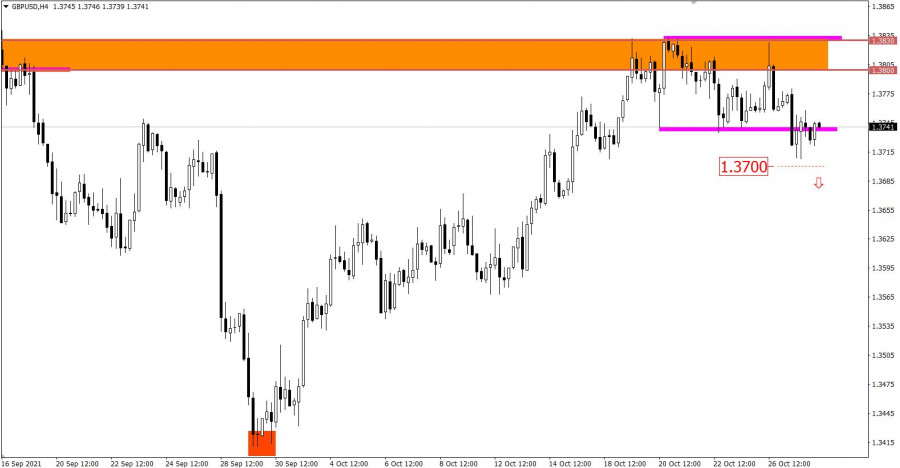
The GBP/USD pair consistently restores the dollar exchange rate relative to the correction from the support point of 1.3400. The resistance is the 1.3800/1.3830 area, where there was a change of trading interests, which led to a gradual decline.

In fact, we are still at the peak of the correction, but at the same time, the first signal to sell the pound sterling already appeared.

This image is no longer relevant

October 28 economic calendar:

The focus today is the European Central Bank's meeting. Market participants are waiting for new information on the prospects for monetary policy in the euro area.

There is no doubt that the parameters of the ECB's monetary policy will remain unchanged, but this does not mean that the situation in the currency market will not change in any way. If Christine Lagarde announces the timing and extent of monetary policy tightening during her press conference, as the Fed and the Bank of England did earlier, then the euro will receive a strong incentive to grow. But if the ECB does not say anything again, then the suspended upward trend of the US dollar will resume.

The results of the ECB meeting - 11:45 Universal time

Press conference - 12:30 Universal time

Trading plan for EUR/USD on October 28:

Today, the side channel in the range of 1.1585/1.1625 is highly likely to end. Trading tactics consider the method of breaking one or another border of the set range.

  • Buy positions will be considered after holding the price above the level of 1.1630.
  • Sell positions will be considered after holding the price below the level of 1.1580.

This image is no longer relevant

Trading plan for GBP/USD on October 28:

Here, special attention is paid to the price area of 1.3700/1.3720, since keeping the price below will lead to an increase in the volume of short positions. This will open the way towards the level of 1.3610.

Otherwise, the lateral amplitude along the resistance area will remain in the market.

This image is no longer relevant

What is reflected in the trading charts?

A candlestick chart view is graphical rectangles of white and black light, with sticks on top and bottom. When analyzing each candle in detail, you will see its characteristics of a relative period: the opening price, closing price, and maximum and minimum prices.

Horizontal levels are price coordinates, relative to which a stop or a price reversal may occur. These levels are called support and resistance in the market.

Circles and rectangles are highlighted examples where the price of the story unfolded. This color selection indicates horizontal lines that may put pressure on the quote in the future.

The up/down arrows are the reference points of the possible price direction in the future.

Gven Podolsky,
انسٹافاریکس کا تجزیاتی ماہر
© 2007-2025
ٹائم فریم منتخب کریں
5
منٹ
15
منٹ
30
منٹ
1
گھنٹہ
4
گھنٹے
1
دن
1
ہفتہ
انسٹافاریکس کے ساتھ کرپٹو کرنسی کی معاملاتی تبدیلیوں سے کمائیں۔
میٹا ٹریڈر 4 ڈاؤن لوڈ کریں اور اپنی پہلی ٹریڈ کھولیں۔
  • Grand Choice
    Contest by
    InstaForex
    InstaForex always strives to help you
    fulfill your biggest dreams.
    مقابلہ میں شامل ہوں

تجویز کردہ مضامین

جون 6-10 2025 کے لیے سونے (ایکس اے یو / یو ایس ڈی) کے لیے تجارتی سگنل: $3,365 سے اوپر خریدیں (21 ایس ایم اے - 7/8 مرے)

دوسری طرف، سونے میں تکنیکی اصلاح کی توقع ہے۔ 30 مئی کو، اس نے 3,284 کے ارد گرد ایک فرق چھوڑا، اور اگر یہ 3,350 سے نیچے مستحکم ہوتا ہے،

Dimitrios Zappas 18:11 2025-06-06 UTC+2

جون 6-10 2025 کے لیے یورو / یو ایس ڈی کے لیے تجارتی سگنل: 1.1080 سے اوپر خریدیں (200 ای ایم اے - 6/8 مرے)

ایگل انڈیکیٹر ایک منفی سگنل دکھا رہا ہے، اس لیے ہمیں یقین ہے کہ اگر آنے والے گھنٹوں میں یورو 6/8 مرے کی سطح سے نیچے گرتا ہے،

Dimitrios Zappas 18:09 2025-06-06 UTC+2

یورو / جے پی وائے : تجزیہ اور پیشن گوئی

یورو / جے پی وائے جوڑا مستحکم مثبت حرکیات کا مظاہرہ کرتا رہتا ہے۔ جگہ کی قیمتیں تین ہفتے کی بلند ترین سطح کے قریب رہیں۔ یورو

Irina Yanina 17:58 2025-06-06 UTC+2

یو ایس ڈی / سی اے ڈی : تجزیہ اور پیشن گوئی

یہ جوڑا خریداروں کو راغب کرنے کی کوشش کر رہا ہے، لیکن اسپاٹ کی قیمتیں سالانہ کم ترین سطح کے قریب رہتی ہیں اور مزید گراوٹ کا شکار دکھائی دیتی

Irina Yanina 17:54 2025-06-06 UTC+2

این ذیڈ ڈی / یوایس ڈی : تجزیہ اور پیشن گوئی

آج این ذیڈ ڈی / یو ایس ڈی پئیر خریداروں کو اپنی طرف متوجہ کرتا ہے، حالانکہ یہ اب بھی 0.6050 کی سطح سے نیچے ہے۔ تمام ٹائم فریموں

Irina Yanina 17:45 2025-06-05 UTC+2

یورو / یو ایس ڈی کی پیشن گوئی برائے 04 جون 2025

منگل کو، یورو / یو ایس ڈی پئیر 1.1454 پر 76.4% ریٹریسمنٹ لیول سے ریباؤنڈ ہوا، امریکی ڈالر کے حق میں پلٹ گیا، اور نیچے کی طرف حرکت شروع

Samir Klishi 21:44 2025-06-04 UTC+2

جی بی پی / جے پی وائے. تجزیہ اور پیشن گوئی

جی بی پی / جے پی وائے پئیر لگاتار دوسرے دن مثبت رفتار حاصل کر رہا ہے۔ تکنیکی نقطہ نظر سے، جی بی پی / جے پی وائے

Irina Yanina 21:39 2025-06-04 UTC+2

جون 03 2025 کو جی بی پی / یو ایس ڈی کی پیشن گوئی

فی گھنٹہ چارٹ پر، پیر کو جی بی پی / یو ایس ڈی پئیر 1.3520 پر 161.8% ریٹریسمنٹ لیول سے اوپر مضبوط ہوا۔ اس طرح، پاؤنڈ کی اوپر کی حرکت

Samir Klishi 16:08 2025-06-03 UTC+2

یورو / یو ایس ڈی 3 جون۔ ای یو افراط زر کے اعداد و شمار کا انتظار ہے۔

پیر کو، یورو / یو ایس ڈی پئیر 1.1374–1.1380 زون کے اوپر مضبوط ہوا اور 1.1454 پر 76.4% ریٹریسمنٹ لیول تک بڑھ گیا۔ اس سطح سے واپسی نے امریکی ڈالر

Samir Klishi 14:34 2025-06-03 UTC+2
ابھی فوری بات نہیں کرسکتے ؟
اپنا سوال پوچھیں بذریعہ چیٹ.
Widget callback
 

Dear visitor,

Your IP address shows that you are currently located in the USA. If you are a resident of the United States, you are prohibited from using the services of InstaFintech Group including online trading, online transfers, deposit/withdrawal of funds, etc.

If you think you are seeing this message by mistake and your location is not the US, kindly proceed to the website. Otherwise, you must leave the website in order to comply with government restrictions.

Why does your IP address show your location as the USA?

  • - you are using a VPN provided by a hosting company based in the United States;
  • - your IP does not have proper WHOIS records;
  • - an error occurred in the WHOIS geolocation database.

Please confirm whether you are a US resident or not by clicking the relevant button below. If you choose the wrong option, being a US resident, you will not be able to open an account with InstaForex anyway.

We are sorry for any inconvenience caused by this message.