Analysis of previous deals:
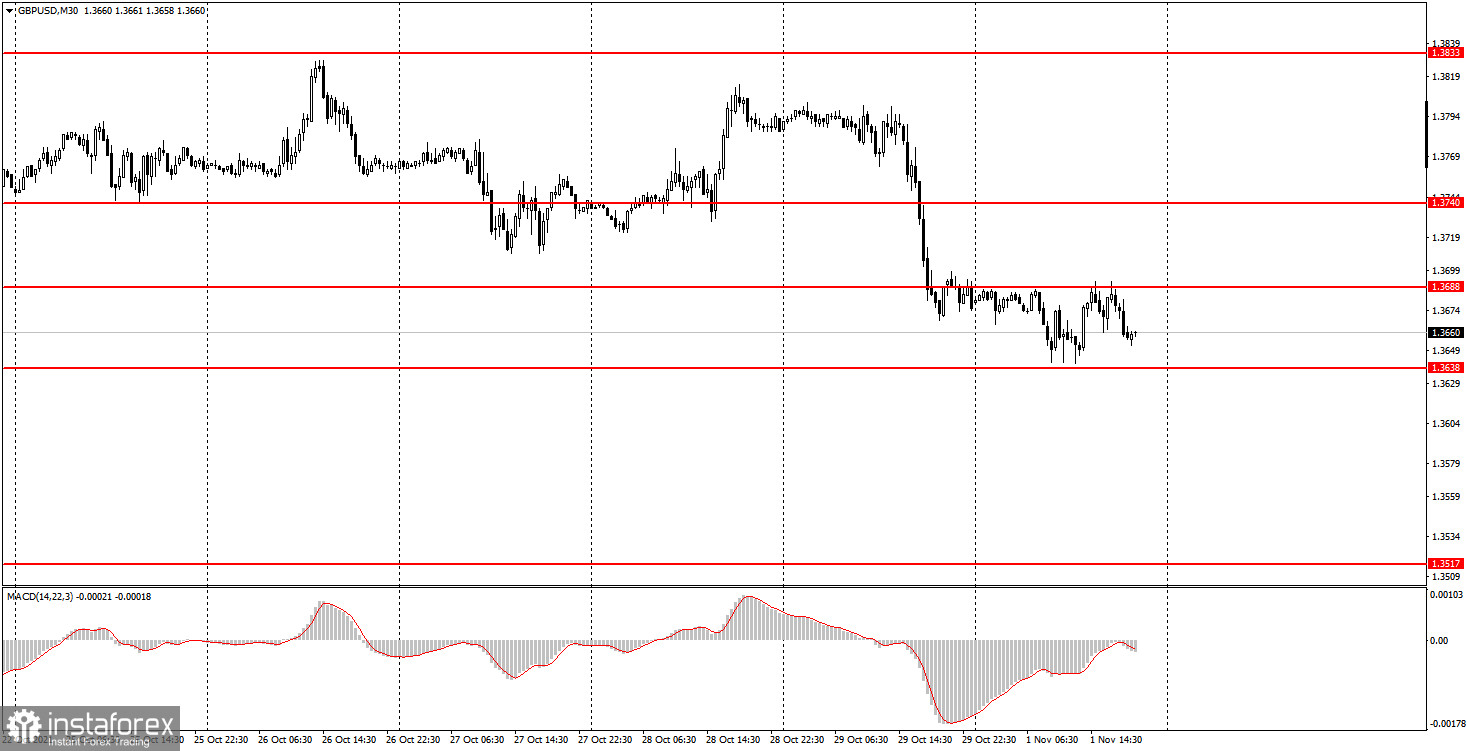
30M chart of the GBP/USD pair
The GBP/USD pair on the 30-minute timeframe spent the entire first trading day of the week in a horizontal channel between the levels of 1.3638 and 1.3688. Thus, all day long, signals were formed near the upper and lower boundaries of this channel. As in the case of the euro/dollar pair, after quite active Thursday and Friday, today everything is back to square one, and the volatility was only 50 points. This value is extremely weak for the pound. A single US ISM manufacturing business report was published during the day. However, it had no effect on the pair's movement. Thus, Monday passed in a complete flat, and the trend or any of its manifestations is now absent. Based on this, we still do not recommend considering trading signals from the MACD indicator, which requires a clear trend and trend movement.
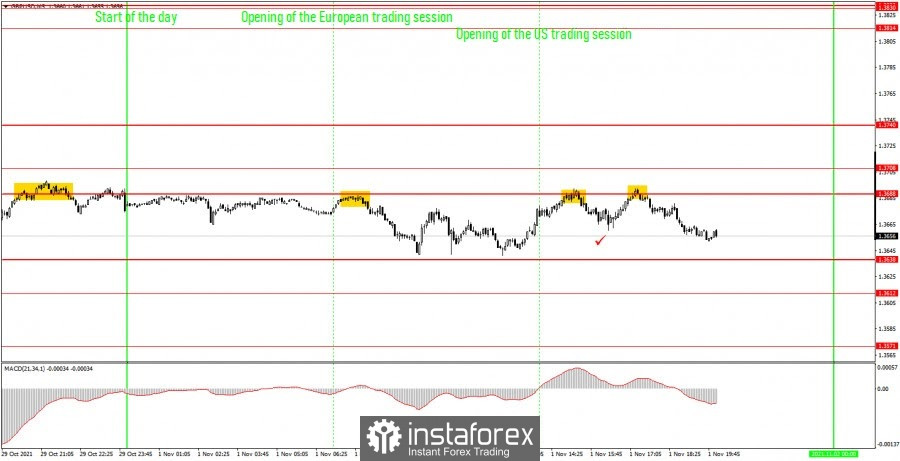
5M chart of the GBP/USD pair

The technical picture on the 5-minute timeframe was even more eloquent on Monday. Typical flat. And novice traders are still very lucky that the price almost perfectly reached the boundaries of the horizontal channel, and in the middle of this channel there was no level near which a pack of false signals could form. And so only three sell signals were formed, all three near the level of 1.3688. Three buy signals could also have formed near the level of 1.3638, but each time the price did not reach literally a few points to this level. However, novice traders could make a profit only in case of profit taking near the level of 1.3638, without waiting for a rebound from it. The problem is that each time out of three the price went down at least 20 points, which was enough to place a Stop Loss order at breakeven. Therefore, no loss was received for any of the open trades. However, the highest that the pair went down on Monday was 30 points, so the least Take Profit could not be triggered, and the closest target level - 1.3638 - was not reached even once. Consequently, in the worst case, the beginners simply did not make any profit or loss on Monday. In the best case, they could have earned several dozen points.
How to trade on Tuesday:
At this time, there is still no trend on the 30-minute timeframe, and the volatility increased rapidly at the end of last week and quickly fell at the beginning of the new one. Since there is no trend, we do not advise beginners to follow the signals on the MACD indicator for some time. A trend movement is required for these signals to be relevant. The important levels on the 5-minute timeframe are 1.3612, 1.3638, 1.3688, 1.3708, 1.3740. We recommend trading on them on Tuesday. The price can bounce off them or overcome them. As before, we set Take Profit at a distance of 40-50 points. At the 5M TF, you can use all the nearest levels as targets, but then you need to take profit, taking into account the strength of the movement. When passing 20 points in the right direction, we recommend setting Stop Loss to breakeven. Novice traders can pay attention only to the index of business activity in the manufacturing sector of the European Union on November 2. This is not the most important report, so it is unlikely that it will have at least some impact on the movement of the currency pair.
Basic rules of the trading system:
1) The signal strength is calculated by the time it took to form the signal (bounce or overcome the level). The less time it took, the stronger the signal.
2) If two or more deals were opened near a certain level based on false signals (which did not trigger Take Profit or the nearest target level), then all subsequent signals from this level should be ignored.
3) In a flat, any pair can form a lot of false signals or not form them at all. But in any case, at the first signs of a flat, it is better to stop trading.
4) Trade deals are opened in the time period between the beginning of the European session and until the middle of the US one, when all deals must be closed manually.
5) On the 30-minute TF, using signals from the MACD indicator, you can trade only if there is good volatility and a trend, which is confirmed by a trend line or a trend channel.
6) If two levels are located too close to each other (from 5 to 15 points), then they should be considered as an area of support or resistance.
On the chart:
Support and Resistance Levels are the Levels that serve as targets when buying or selling the pair. You can place Take Profit near these levels.
Red lines are the channels or trend lines that display the current trend and show in which direction it is better to trade now.
The MACD indicator consists of a histogram and a signal line. When they cross, this is a signal to enter the market. It is recommended to use this indicator in combination with trend lines (channels and trend lines).
Important speeches and reports (always contained in the news calendar) can greatly influence the movement of a currency pair. Therefore, during their exit, it is recommended to trade as carefully as possible or exit the market in order to avoid a sharp price reversal against the previous movement.
Beginners on Forex should remember that not every single trade has to be profitable. The development of a clear strategy and money management are the key to success in trading over a long period of time.