Analyzing Tuesday trades
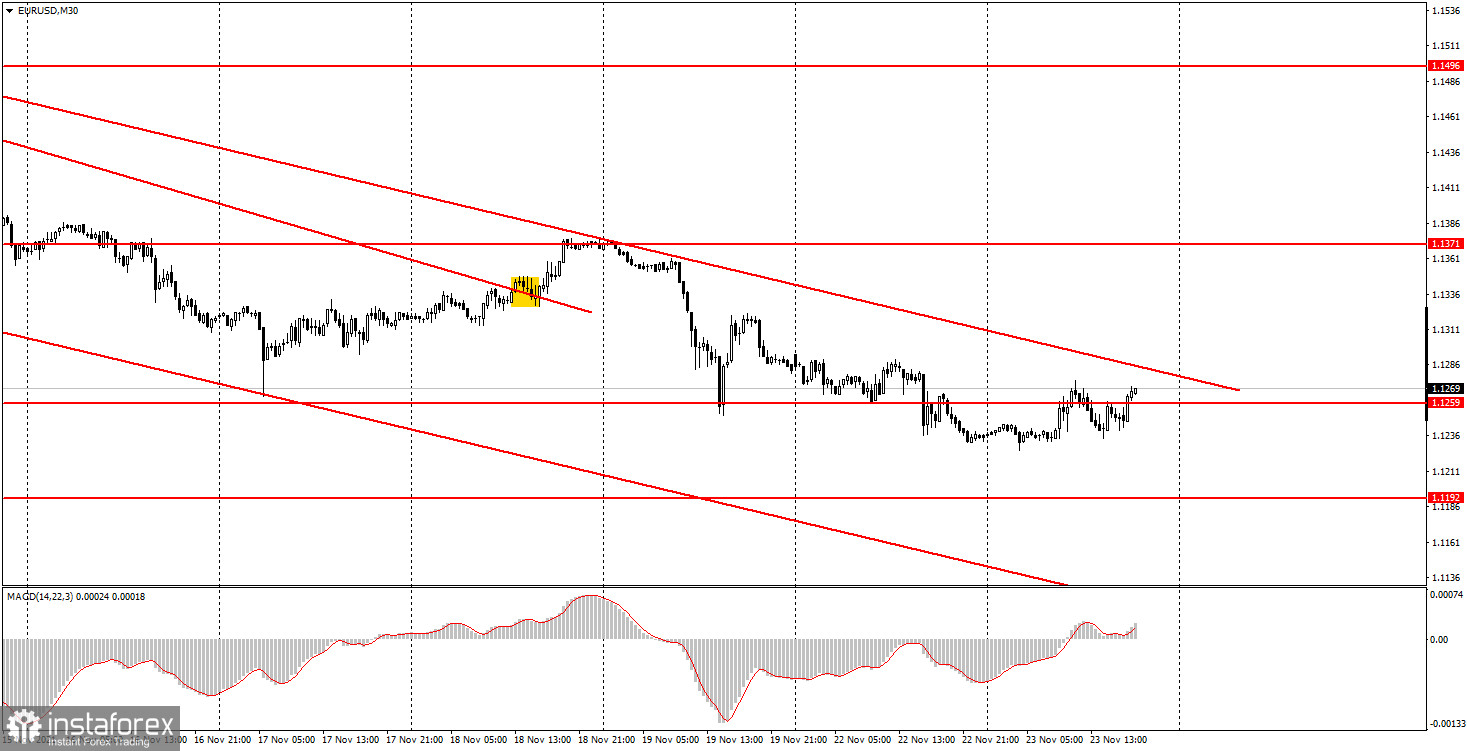
EUR/USD on M30 chart
The EUR/USD pair was trading steadily on Tuesday, with its downtrend put on a halt. The new descending channel means that the downtrend is still in place. But just a couple of days ago, the quotes crossed the descending trendline. So, the current downtrend channel is strong but not relevant at the same time. This is due to the nature of the pair movement:it can be trading flat for several days and then fall sharply. At the moment of a flat movement, the quotes can leave the channel or overcome the trendline, which is misleading. However, strong signals can appear near the upper boundary of the channel, depending on whether the rebound or a breakout occurs. It should also be noted that today's macroeconomic data turned out to be rather weak and there was no reaction to it. This is exactly what we warned you about yesterday.
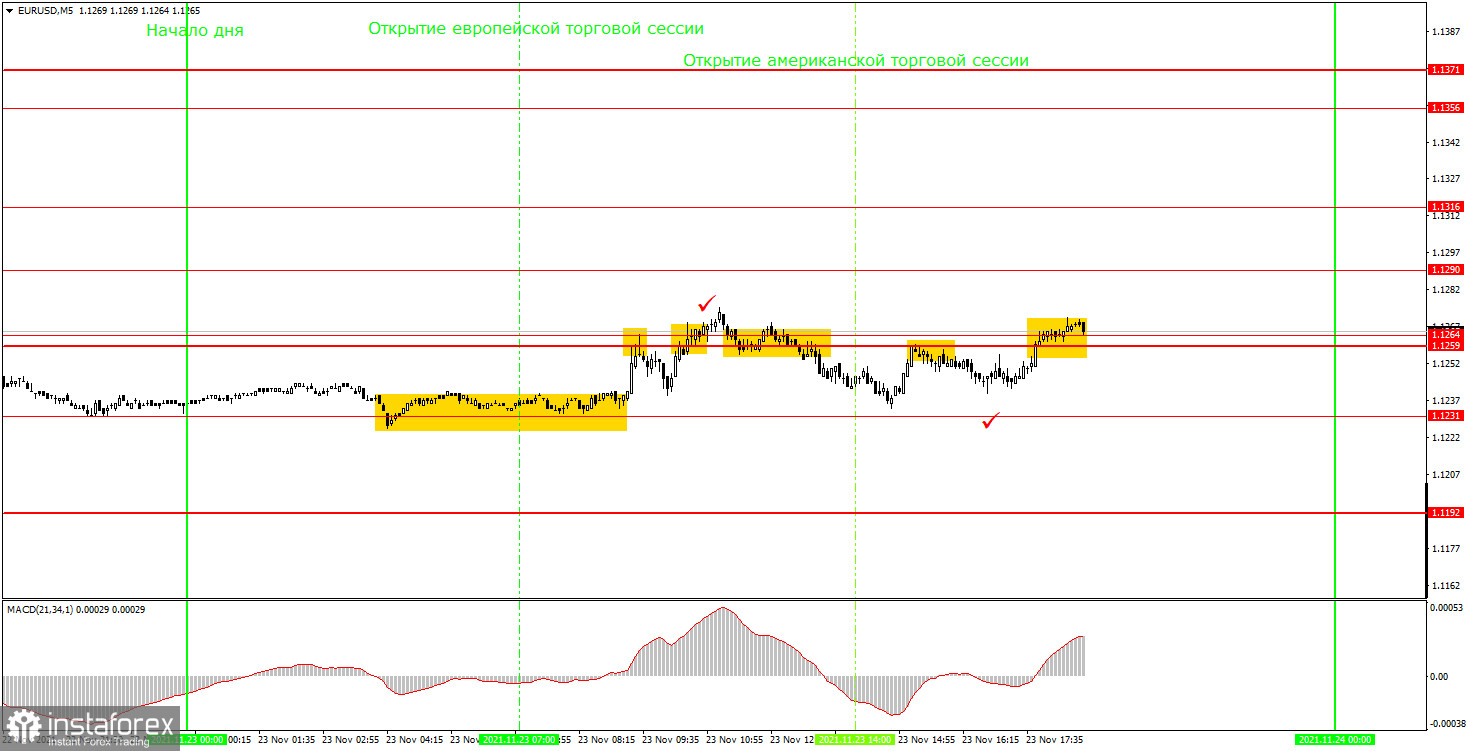
EUR/USD on M5 chart
On the 5-minute time frame, the trajectory on Tuesday was very close to a flat movement. At the same time, a lot of signals were generated, some of which could have brought profit. The level of 1.1231 is the low of the previous day, which was formed after our yesterday's review. Today, a buy signal was formed near this level early in the morning as the price bounced off it. This signal was not strong but traders could still use it. The upward movement ended near the level of 1.1259, from which the price rebounded later. Therefore, at this point, beginners had to close long positions and open short ones. The profit on the long position was 12 pips. Unfortunately, the sell signal did not bring any profit as the pair failed to reach the level of 1.1231 and only went down by 15 pips. However, this was enough to place a Stop Loss order at a breakeven level. The trade was closed as the order was triggered as soon as the pair had consolidated above the level of 1.1264. Traders should have opened new long positions at this point. Yet, they were closed with a loss of 15 pips since the price dropped below the level of 1.1259. All signals that followed after that also formed near the levels of 1.1259 and 1.1264. So, they should not have been used anymore as two false signals had already been generated near them.
Trading tips for Wednesday
On the 30-minute time frame, the downtrend prevails. Thus, the downward movement is likely to continue. Therefore, selling the instrument should be a priority in any trading system before the price settles above the channel. On the 5-minute timeframe, the key levels for November 24 are 1.1192, 1.1231, 1.1259 - 1.1264, and 1.1316. Take Profit should be set at a distance of 30-40 points. Stop Loss should be placed to a breakeven point as soon as the price passes 15 pips in the right direction. On the M5 chart, the nearest level could serve as a target unless it is located too close or too far away. If it is, then you should act according to the situation or trade with a Take Profit. On Wednesday, there will be plenty of important reports and events, and most of them – in the US. Thus, novice traders will have to carefully watch the data on durable goods orders, GDP, and personal income and expenses. In the evening, when all trades should be closed, the Fed's minutes from the last meeting will be published.
Basic rules of the trading system
1) The strength of the signal is determined by the time the signal took to form (a bounce or a breakout of the level). The quicker it is formed, the stronger the signal is.
2) If two or more positions were opened near a certain level based on false signals (which did not trigger a Take Profit or test the nearest target level), then all subsequent signals at this level should be ignored.
3) When trading flat, a pair can form multiple false signals or not form them at all. In any case, it is better to stop trading at the first sign of a flat movement.
4) Trades should be opened in the period between the start of the European session and the middle of the US trading hours when all positions must be closed manually.
5) You can trade using signals from the MACD indicator on the 30-minute time frame only given that volatility is strong and there is a clear trend that should be confirmed by a trend line or a trend channel.
6) If two levels are located too close to each other (from 5 to 15 pips), they should be considered support and resistance levels.
On the chart
Support and Resistance Levels are the levels that serve as targets when buying or selling the pair. You can place Take Profit near these levels.
Red lines are channels or trend lines that display the current trend and show in which direction it is better to trade now.
The MACD indicator (14, 22, and 3) consists of a histogram and a signal line. When they cross, this is a signal to enter the market. It is recommended to use this indicator in combination with trend patterns (channels and trend lines).
Important announcements and economic reports that you can always find on the economic calendar can seriously influence the trajectory of a currency pair. Therefore, at the time of their release, we recommend trading as carefully as possible or exiting the market in order to avoid sharp price fluctuations.
Beginners on Forex should remember that not every single trade has to be profitable. The development of a clear strategy and money management is the key to success in trading over a long period of time.