Here are the details of the economic calendar for November 23, 2021:
Yesterday, speculators spent the whole day watching the statistical data on business activity indices.
Let's look at them in detail in the context of each country.
Europe published its index of business activity in the manufacturing sector at 9:00 Universal time, where it suddenly showed not a decline, but growth, which confused the markets. The euro quote locally strengthened, but then returned to its original position, resuming the downward cycle. In terms of the details of the indicator, the production index rose from 58.3 to 58.6 points, against the expected decline to 57.5 points. At the same time, the index of business activity in the service sector, which was supposed to fall from 54.6 to 54.0 points, rose to 56.6 points.
Similar data were published for the UK at 9:30 Universal time, but like in Europe, the indices showed growth instead of declining. The manufacturing index increased from 57.8 to 58.2 points, against the forecast of 57.1 points. The business activity in the service sector in the country still declined, although not as much as predicted. In fact, it decreased only to 58.6 points when it should have decreased from 59.1 to 58.3 points.
The pound sterling did not pay attention to the discrepancy in statistical data and continued to decline.
The United States reported on indices at 14:45 Universal time, where growth was predicted, but the data came out slightly worse than expected, which locally weakened dollar positions.
Here, the index of business activity in the manufacturing sector confirmed expectations for growth. It surged from 58.4 to 59.1 points. However, everything is not so smooth in the service sector. The index was expected to grow from 58.7 to 59.0 points, but instead, it fell to 57.0 points.
Analysis of trading charts from November 23:
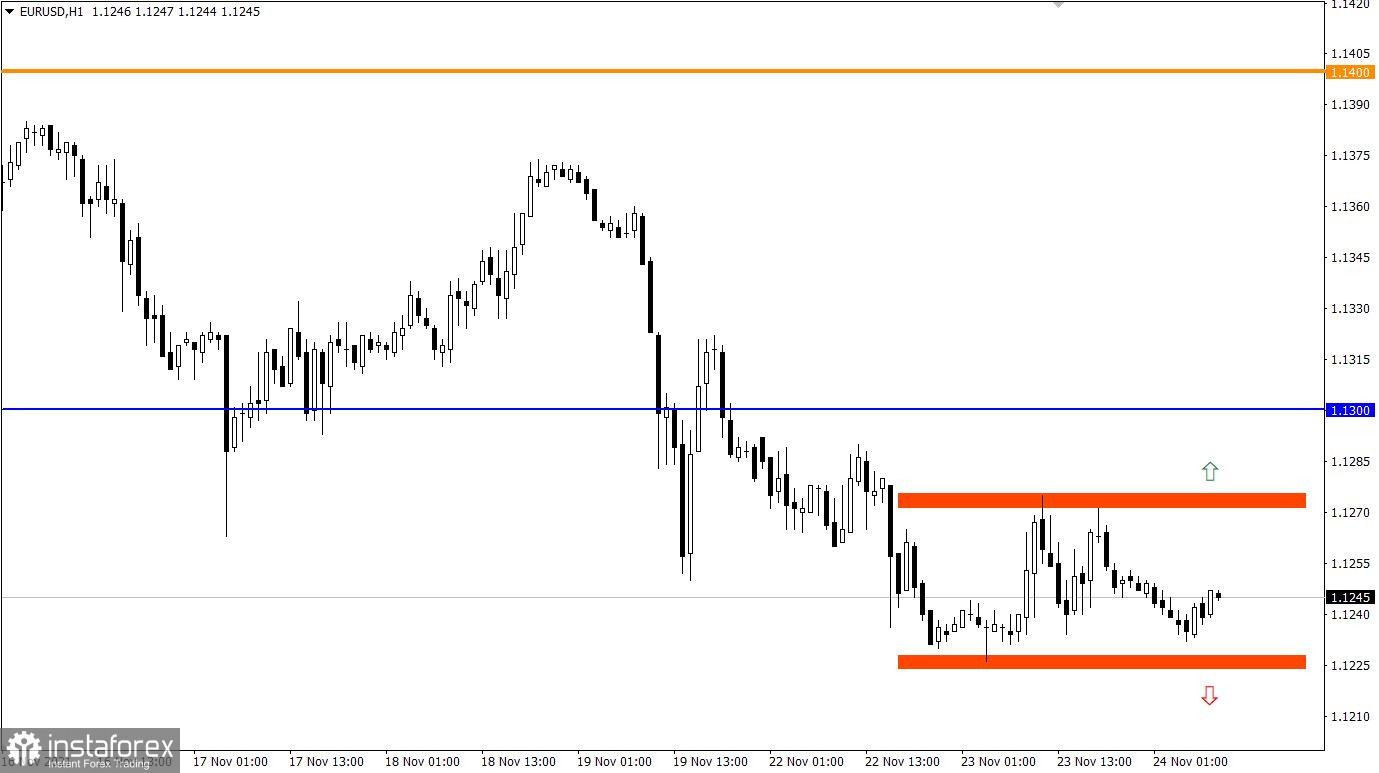
The EUR/USD pair slowed down the downward cycle around the base of 2021. As a result, there was a price stagnation within the borders of 1.1225/1.1275. Despite the temporary stop, sellers dominate the market, as indicated by a stable downward trend from the beginning of June, the scale of which is 1000 points.
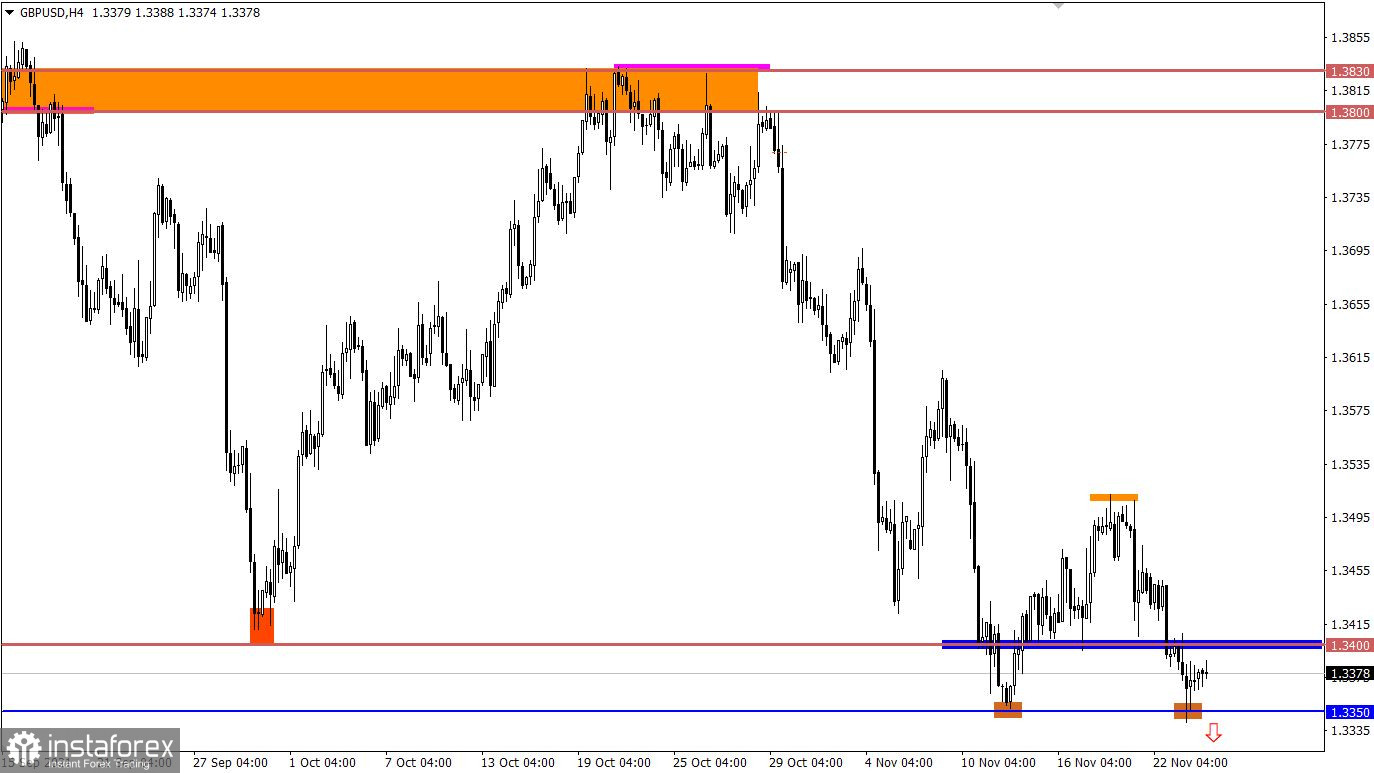
The GBP/USD pair resumed its downward movement after a slight pullback, which led to the price holding below the support level of 1.3400. As a result, the quote strengthened the downward course, piercing the local low of November 12 – 1.3350 with candle shadows.
The trading plan on November 23 considered the scenario of downward price development towards the level of 1.3350. A trading recommendation could bring us a profit in the area of 25-30 points, which is $ 25-30 with a transaction volume of 1 Installot.
November 24 economic calendar:
The next estimate of the US GDP for the third quarter will be published today at 13:30 Universal time, where the economic growth rate is predicted from 2.0% to 2.1%. This is considered a positive factor.
At the same time, data on orders for durable goods in the country will be published, where they are forecast to grow by 0.3%. It should be noted that this indicator is considered one of the best economic indicators of the state of consumer activity. Thus, the growth of orders for durable goods may well support the US dollar.
The data on applications for unemployment benefits in the United States will also be released, where they predict a slight reduction in their volume.
Details of statistics:
The volume of initial applications for benefits may fall from 268 thousand to 260 thousand.
The volume of repeated applications for benefits may fall from 2,080 thousand to 2,033 thousand.
The reason for the release of the filing data a day earlier is due to the Thanksgiving Day holiday in the United States on November 25 .
Trading plan for EUR/USD on November 24:
It can be assumed that the price movement in the range of 1.1225 / 1.1275 will remain on the market for some time. This will lead to an accumulation of trade forces.
In case of coincidence of expectations, the most suitable trading tactic is considered to be the method of breaking through one or another border of the established range.
Trading recommendations:
Buy positions should be considered after holding the price above the level of 1.1280.
Sell positions should be considered after holding the price below the level of 1.1220.
Trading plan for GBP/USD on November 24:
Since the quote touched this year's local low, there was a reduction in the volume of short positions. This led to a natural price rebound, followed by a slowdown. In order to prolong the downward cycle to new price levels, the quote needs to stay below the level of 1.3350 for at least a four-hour period. Otherwise, there may be a pullback to the previously passed level of 1.3400.
What is reflected in the trading charts?
A candlestick chart view is graphical rectangles of white and black light, with sticks on top and bottom. When analyzing each candle in detail, you will see its characteristics of a relative period: the opening price, closing price, and maximum and minimum prices.
Horizontal levels are price coordinates, relative to which a stop or a price reversal may occur. These levels are called support and resistance in the market.
Circles and rectangles are highlighted examples where the price of the story unfolded. This color selection indicates horizontal lines that may put pressure on the quote in the future.
The up/down arrows are the reference points of the possible price direction in the future.
: