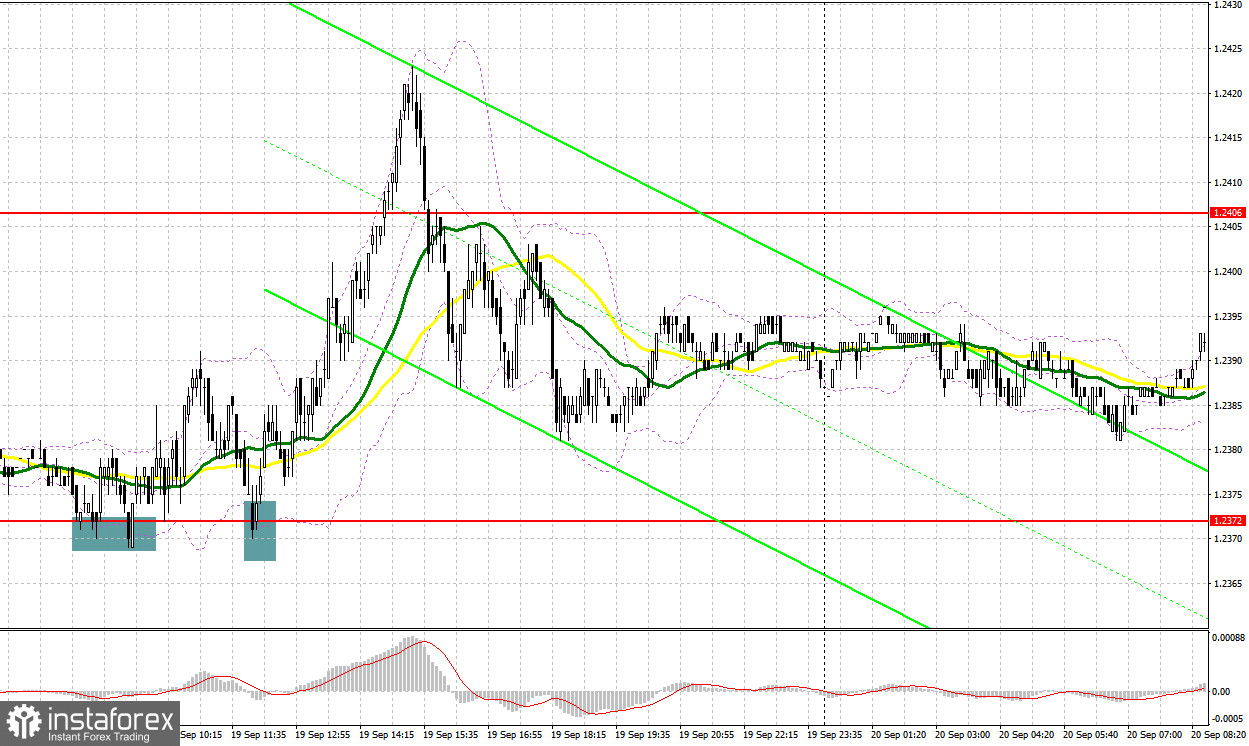
Yesterday, the pair formed several good entry signals. Let's see what happened on the 5-minute chart. In my morning review, I mentioned the level of 1.2372 as a possible entry point. A decline to this level and its false breakout generated a buy signal, pushing the price up by 40 pips. In the afternoon, no other good entry points were formed.
For long positions on GBP/USD
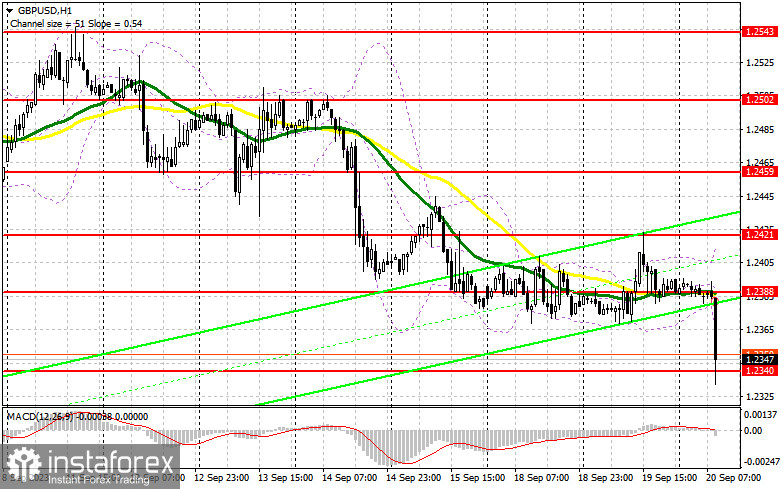
Today's inflation data from the UK allows the Bank of England to pause its rate hiking cycle, which resulted in a significant sell-off in the British pound. On the one hand, annual inflation slowed down, but on a monthly basis, the price pressure increased. In any case, pressure on the pound will continue due to the upcoming Federal Reserve meeting, which we will discuss in more detail later in the day. For now, buyers need to defend the 1.2340 level, where a false breakout will provide an initial entry point for long positions against the bear market, aiming for a correction to the nearest resistance at 1.2388. This level is marked by moving averages that favor the sellers, so it won't be easy to break out of this range. A breakout and stabilization above 1.2388 will bolster buyer confidence, signaling long positions aiming for 1.2421, where I anticipate stronger sellers to appear. The more distant target is the 1.2459 area, where I will be taking profits. However, reaching this level will only be feasible if the Federal Reserve maintains a dovish stance. If there is another dip to 1.2340 without buyer activity, pressure on the pound will increase, aiming for new monthly lows. In that case, only the defense of 1.2308 and a false breakout there will signal long positions. I plan to buy GBP/USD immediately on a rebound only from the 1.2275 low, aiming for a daily correction of 30-35 pips.
For short positions on GBP/USD
Bears need to defend the nearest resistance at 1.2388 and take control of the new low at 1.2340. Ideally, selling on a correction from 1.2388 would be the best scenario, but I will act there only after a failed consolidation. It will serve as a sell signal with the prospect of another drop to 1.2340. A breakout and a bottom-up retest of this range will likely occur later in the day after the Federal Reserve meeting, striking a significant blow to the bulls and opening a downward path to the 1.2308 support. The more distant target remains the 1.2275 area, where I will be taking profits. If GBP/USD rises and there is no activity at 1.2388 – which I personally doubt – buyers will get a chance for a correction ahead of the US central bank meeting. In that case, I will postpone selling the pair until a false breakout at 1.2421. If there is no downward movement there, I will sell the pound immediately on a rebound from 1.2459, but only aiming for a 30-35 pip correction within the day.

COT report
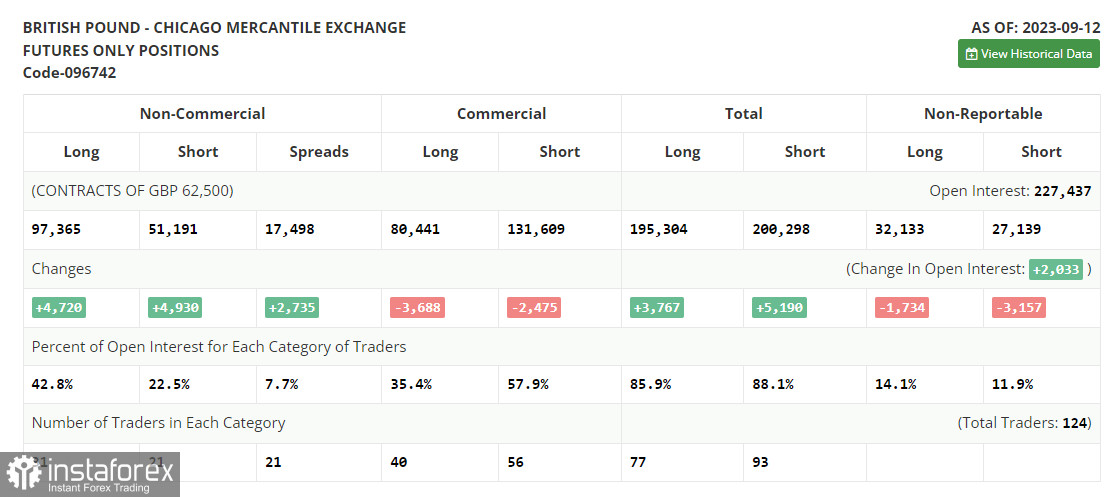
The COT report (Commitments of Traders) for September 12 indicated an increase in both long and short positions. The released data on average earnings in the UK, which clearly has a negative impact on inflation, combined with the decrease in the UK's GDP led to another sell-off in the British pound, which may intensify in the near future. Apart from the Bank of England's meeting, where further actions regarding interest rates are not clear, a consumer price index report is planned. Almost all economists expect an increase in inflationary pressure in the UK in August. Given the backdrop of a weakening economy, we may expect another significant sell-off of the pound against the US dollar. The latest COT report indicates that non-commercial long positions increased by 4,720 to 97,365, while non-commercial short positions also jumped by 4,930 to 51,191. As a result, the spread between long and short positions increased by 2,735. The weekly closing price dropped to 1.2486 from 1.2567.

Indicator signals:
Moving Averages
Trading below the 30- and 50-day moving averages indicates a further decline in the pair.
Please note that the time period and levels of the moving averages are analyzed only for the H1 chart, which differs from the general definition of the classic daily moving averages on the D1 chart.
Bollinger Bands
If the pair declines, the lower band of the indicator at 1.0657 will act as support. If the price goes up, the upper band of the indicator at 1.0695 will serve as resistance.
Description of indicators:
• A moving average of a 50-day period determines the current trend by smoothing volatility and noise; marked in yellow on the chart;
• A moving average of a 30-day period determines the current trend by smoothing volatility and noise; marked in green on the chart;
• MACD Indicator (Moving Average Convergence/Divergence) Fast EMA with a 12-day period; Slow EMA with a 26-day period. SMA with a 9-day period;
• Bollinger Bands: 20-day period;
• Non-commercial traders are speculators such as individual traders, hedge funds, and large institutions who use the futures market for speculative purposes and meet certain requirements;
• Long non-commercial positions represent the total number of long positions opened by non-commercial traders;
• Short non-commercial positions represent the total number of short positions opened by non-commercial traders;
• The non-commercial net position is the difference between short and long positions of non-commercial traders.