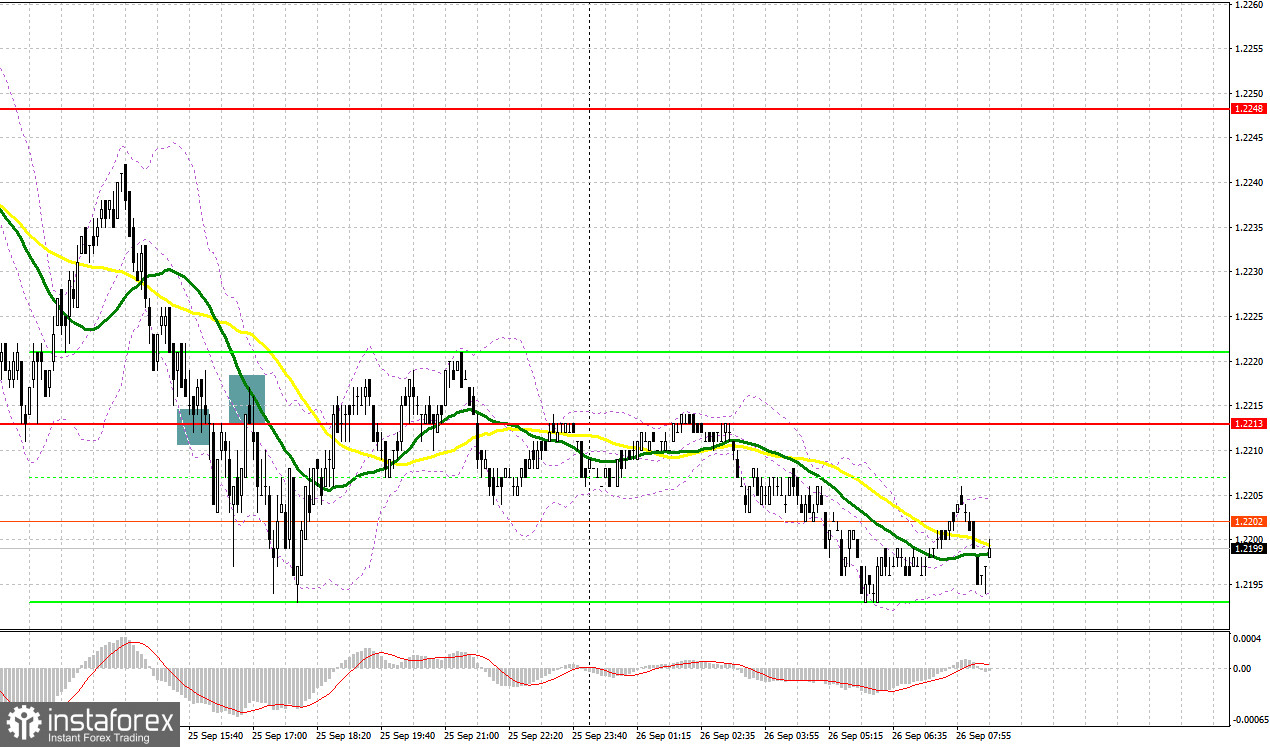
Yesterday, the pair formed several entry signals. Let's see what happened on the 5-minute chart. In my morning review, I mentioned the level of 1.2232 as a possible entry point. We saw a breakthrough but there was no upward retest. As a result, the pair fell. In the afternoon, protecting the 1.2213 level was a good signal to buy the pound, but the pair did not rise, so we had to consolidate losses. A breakout and upward retest of this mark produced a sell signal, resulting in a 30-pip fall.
COT report:
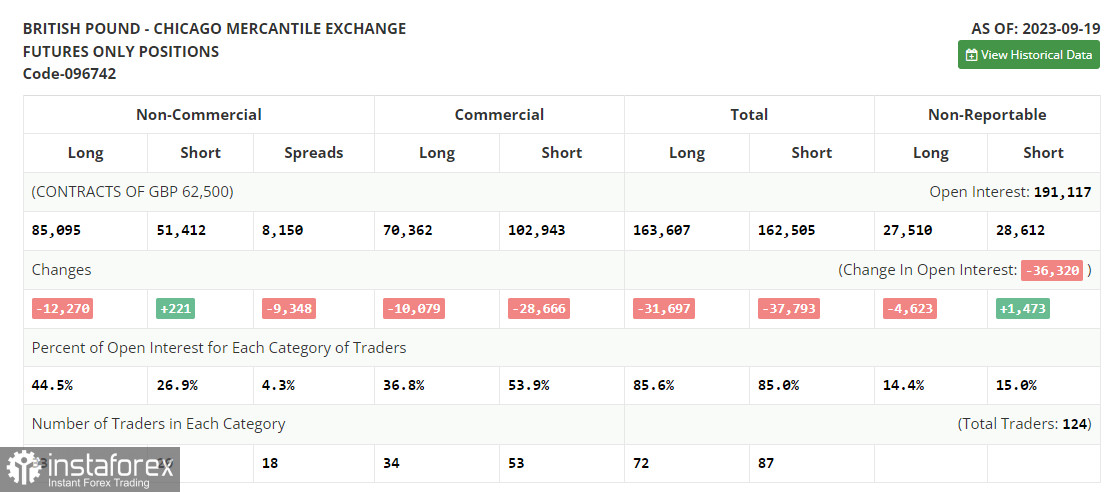
Before analyzing the technical picture of the pound, let's see what happened in the futures market. The COT report (Commitments of Traders) for September 19 indicated a decrease in long positions and a slight increase in short positions. This shows that although the number of bulls have decreased, there is no distinct growth in the number of bears. The UK inflation data influenced the Bank of England's decision, which left the rates unchanged, surprising many people. Traders took this news as a negative, as the central bank is apparently at the peak of its rate hike cycle, which reduces the appeal of the pound. Given that the UK economy could even show a sharp slowdown in Q3, it's no wonder why the pound is actively falling against the US dollar. The latest COT report indicates that non-commercial long positions decreased by 12,270 to 85,095, while non-commercial short positions increased by only 221 to 51,412. As a result, the spread between long and short positions narrowed by 9,348. The weekly closing price dropped to 1.2390 against 1.2486.
For long positions on GBP/USD:
No significant UK data today, so don't be surprised if the pair continues to lose positions. I expect buyers to emerge at the nearest support at 1.2168. A false breakout will signal market entry into long positions with a move to the resistance at 1.2213, which was formed as a result of Monday. A breakout and downward test of this range will bolster buyer confidence, providing a chance for GBP/USD to reach a new resistance at 1.2248. In case the price breaks above this range, we can talk about a breakout to 1.2282, where I will be taking profits. If there is another dip to 1.2168 without buyer activity, which is where things are headed, pressure on the pound will increase, and the pair will continue to fall. In that case, only the defense of 1.2115 and a false breakout there will signal long positions. I plan to buy GBP/USD immediately on a rebound only from 1.2066, aiming for a daily correction of 30-35 pips.
For short positions on GBP/USD:
The bears did everything that was required of them. Today it would be good to see a breakout to 1.2213. A false breakout at this mark will confirm the presence of major sellers in the market, which will signal a sell opportunity. GBP/USD may decline towards the support at 1.2168. A breakout and an upward retest of this range will strengthen the bears' advantage, providing an entry point for selling and GBPUSD could reach the target of 1.2115. The more distant target remains the 1.2066 area, where I will be taking profits. If GBP/USD rises and there is no activity at 1.2213, this level is marked by moving averages that favor the sellers, buyers will get a chance to correct higher, and the pair could rise to the next resistance at 1.2248. If there is no downward movement there, I will sell the pound immediately on a rebound from 1.2282, bearing in mind a 30-35-pips downward intraday correction.
Indicator signals:
Moving Averages
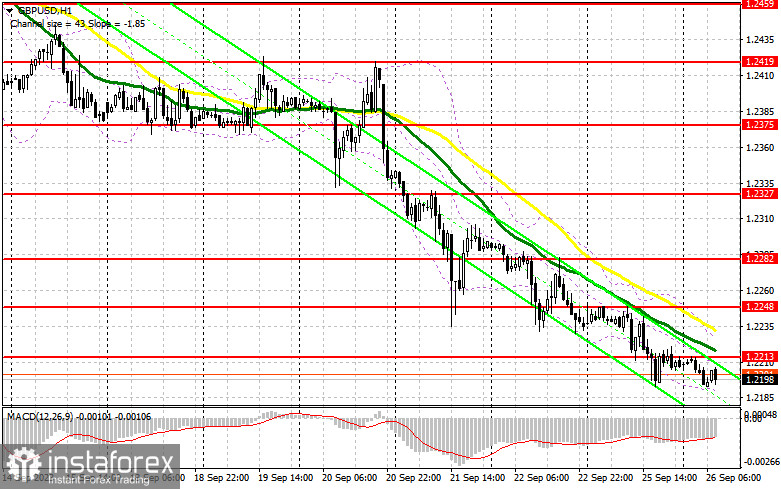
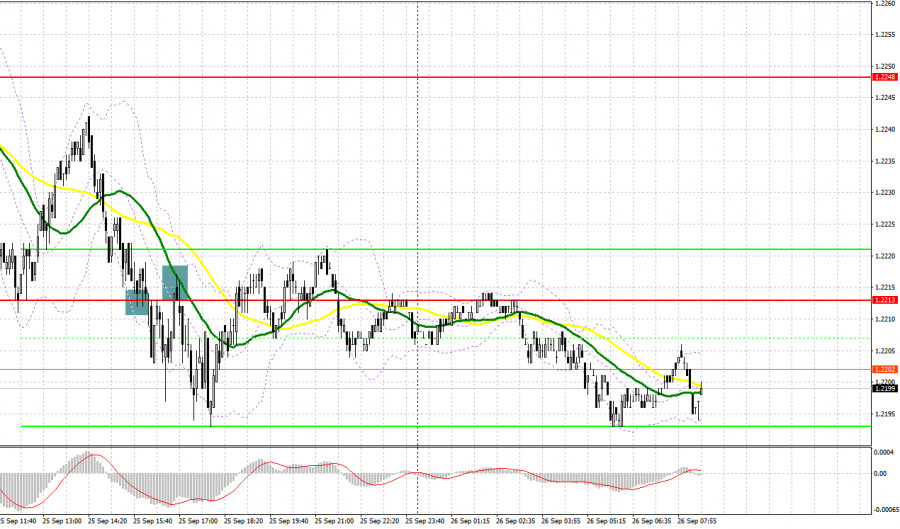
Trading below the 30- and 50-day moving averages indicates a further decline in the pair.
Please note that the time period and levels of the moving averages are analyzed only for the H1 chart, which differs from the general definition of the classic daily moving averages on the D1 chart.
Bollinger Bands
If the pair grows, the upper band of the indicator near 1.2225 will act as resistance. If the pair falls, the lower band of the indicator near 1.2180 will act as support.
Description of indicators:
• A moving average of a 50-day period determines the current trend by smoothing volatility and noise; marked in yellow on the chart;
• A moving average of a 30-day period determines the current trend by smoothing volatility and noise; marked in green on the chart;
• MACD Indicator (Moving Average Convergence/Divergence) Fast EMA with a 12-day period; Slow EMA with a 26-day period. SMA with a 9-day period;
• Bollinger Bands: 20-day period;
• Non-commercial traders are speculators such as individual traders, hedge funds, and large institutions who use the futures market for speculative purposes and meet certain requirements;
• Long non-commercial positions represent the total number of long positions opened by non-commercial traders;
• Short non-commercial positions represent the total number of short positions opened by non-commercial traders;
• The non-commercial net position is the difference between short and long positions of non-commercial traders.