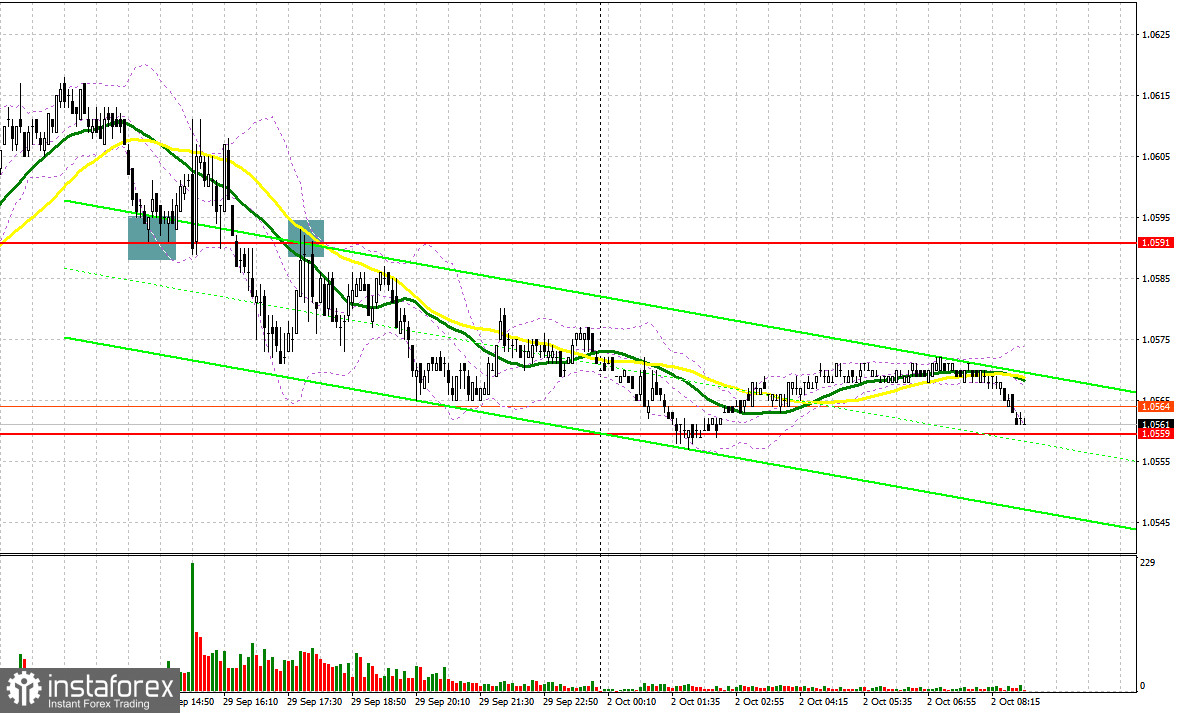
Last Friday, the pair formed several entry signals. Let's have a look at what happened on the 5-minute chart. In my morning review, I mentioned the level of 1.0608 as a possible entry point. A rise and a false breakout at this mark produced a great sell signal, but the pair failed to move down. In the afternoon, a false breakout from 1.0591 created an entry point into long positions, sending the price upwards by about 20 pips. Afterwards the bears achieved a breakout and an upward test of this range that generated a sell signal and the euro fell by about 25 pips.
For long positions on EUR/USD:
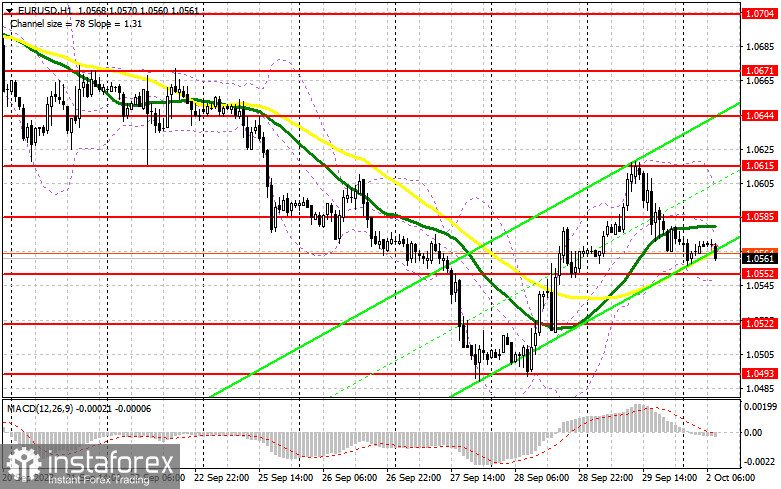
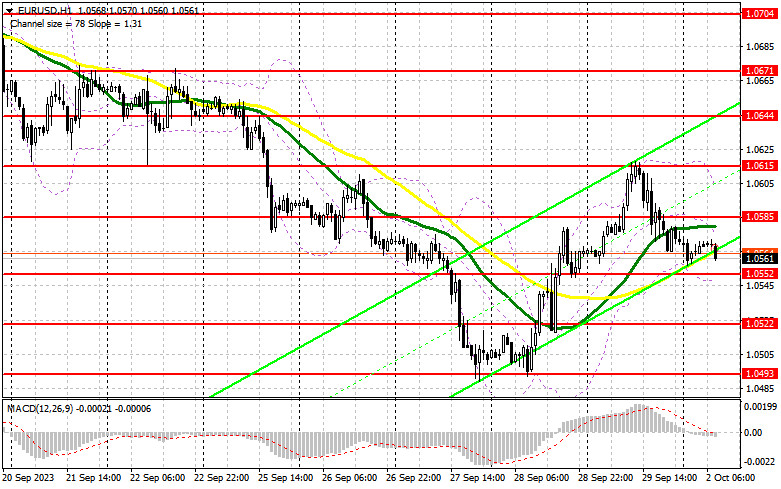
On Friday, US inflation data brought back demand for the dollar, as the figures matched economists' forecasts, which is more of a bad thing for determining the future of the Federal Reserve's monetary policy. Today, pressure on the euro could increase if the final reading of the HCOB Manufacturing PMI is downwardly revised. Let me remind you that the reaction to the preliminary data provided support to the bears. The eurozone unemployment rate is unlikely to affect the balance of power. For this reason, I will act on a decline near the nearest support at 1.0552. A false breakout around that mark will confirm the entry point for long positions, in hopes of building an upward correction and updating the nearest resistance at 1.0585. A breakout and a downward test of this range, bolstered by strong data from the eurozone, will increase demand for the euro, providing a chance for a surge to 1.0615 - last week's high. The furthest target would be the 1.0644 area, where I plan to take profits. If EUR/USD declines and there is no activity at 1.0552, the pressure will return. In such a case, only a false breakout near 1.0522 will signal a buying opportunity. I will open long positions directly on a rebound from 1.0493, aiming for an upward correction of 30-35 pips within the day.
For short positions on EUR/USD:
The sellers were active at the end of last week, and today, the pair may be under pressure. In this case, the bears need to defend the new resistance at 1.0585 and weak eurozone data to push the pair to the 1.0552 low. Only after breaching this range and settling below it, on the back of weak eurozone Manufacturing PMIs which leads to lower GDP growth rates, and after completing an upward retest, do I anticipate another sell signal with a target at 1.0522, where I expect significant buyer activity. The furthest target is the 1.0493 area, where I plan to take profit. If EUR/USD moves upward during the European session and lacks bearish activity at 1.0585, bulls will continue the upward correction. In such a scenario, I would delay short positions until the price hits the resistance at 1.0615, where the euro has already fallen once last Friday. I would also consider selling there but only after an unsuccessful consolidation. I will open short positions directly on a rebound from the high of 1.0644, considering a downward correction of 30-35 pips.
COT report:
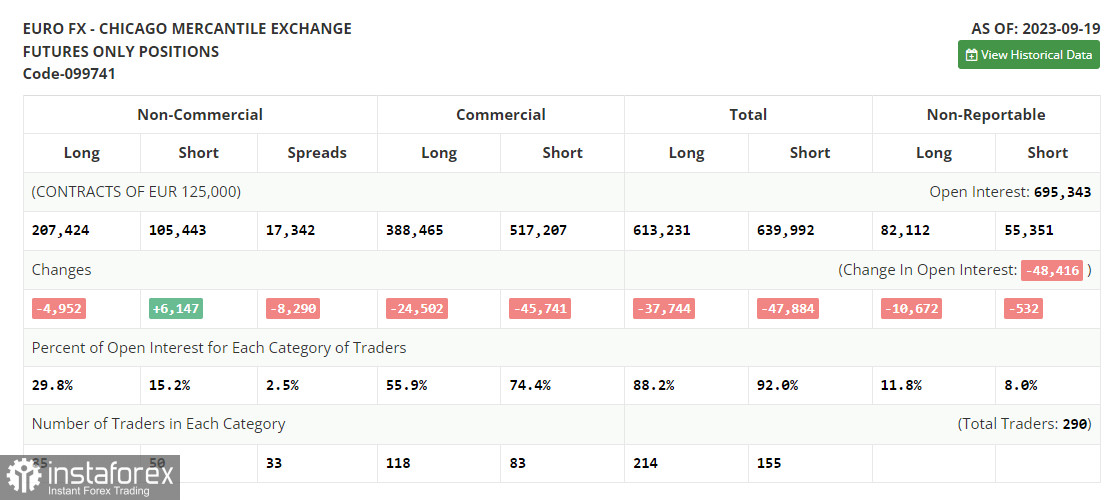
The COT report for September 19 showed a sharp decline in long positions and a rise in the short ones. Adverse shifts in the Eurozone's economic landscape and looming threats of further interest rate hikes by the European Central Bank (ECB) have bolstered the prevailing bearish sentiment. Interestingly, the euro did not find much respite even after the Federal Reserve decided to hold rates steady. However, it is worth noting that the Fed clearly communicated the possibility of another rate increase before the year ends. The COT report indicates that non-commercial long positions dipped by 4,952 to stand at 207,424. Conversely, non-commercial short positions saw an increase of 6,147, reaching a total of 105,443. As a result, the spread between long and short positions narrowed by 8,290 contracts. The closing price dropped to 1.0719 from 1.0736, further underscoring the bearish market sentiment for EUR/USD.
Indicator signals:
Moving averages:
Trading is taking place around the 30-day and 50-day moving averages, indicating a sideways market trend.
Please note that the time period and levels of the moving averages are analyzed only for the H1 chart, which differs from the general definition of the classic daily moving averages on the D1 chart.
Bollinger Bands
If EUR/USD declines, the indicator's lower border near 1.0552 will serve as support.
Description of indicators:
• A moving average of a 50-day period determines the current trend by smoothing volatility and noise; marked in yellow on the chart;
• A moving average of a 30-day period determines the current trend by smoothing volatility and noise; marked in green on the chart;
• MACD Indicator (Moving Average Convergence/Divergence) Fast EMA with a 12-day period; Slow EMA with a 26-day period. SMA with a 9-day period;
• Bollinger Bands: 20-day period;
• Non-commercial traders are speculators such as individual traders, hedge funds, and large institutions who use the futures market for speculative purposes and meet certain requirements;
• Long non-commercial positions represent the total number of long positions opened by non-commercial traders;
• Short non-commercial positions represent the total number of short positions opened by non-commercial traders;
• The non-commercial net position is the difference between short and long positions of non-commercial traders.