Yesterday GBP/USD generated several signals to enter the market. Let's look at the 5-minute chart and try to figure out what actually happened. In my morning forecast, I paid attention to the level of 1.2193 and recommended making decisions on entering the market from there. A return and a bottom-up test of this area after the publication of rather weak data for the UK was followed by a sell signal. As a result, GBP/USD fell by almost 40 pips. In the afternoon, the buyers actively defended 1.2152 several times, but after moving up by 15 points, the pair came under selling pressure again. Buying on the rebound from 1.2112 allowed us to withdraw about 30 pips of profit from the market.
What is needed to open long positions on GBP/USD
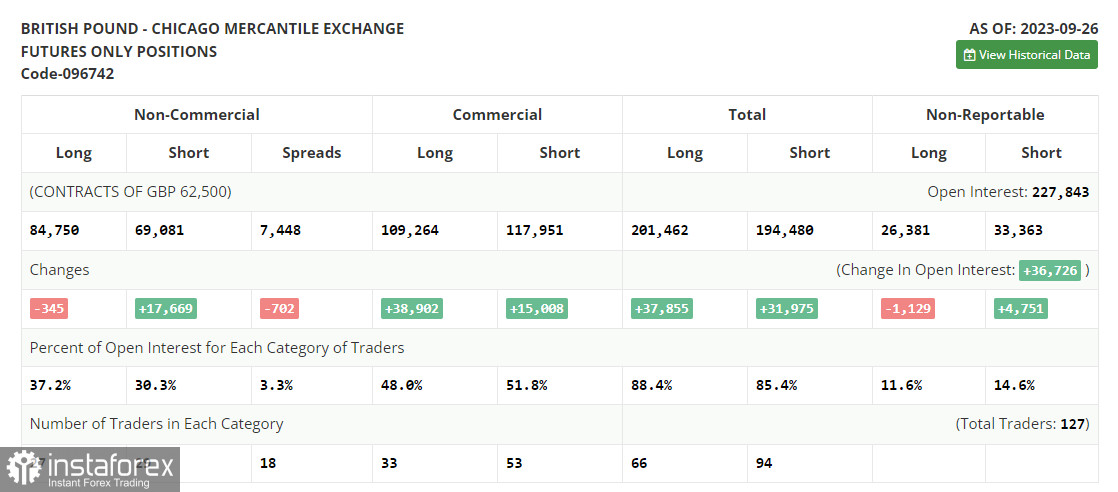
Before looking at the technical picture of GBP/USD, let's look at what happened in the futures market. The COT (Commitment of Traders) report for September 26 logged a decrease in long positions and a very large increase in short positions. It means there are fewer and fewer buyers of the pound sterling, especially after downbeat UK GDP data. The UK economic growth is expected to slow down significantly in the 3rd quarter. No wonder, the British pound is actively falling against the US dollar. The latest COT report said long non-commercial positions fell by 345 to 84,750, while short non-commercial positions increased by 17,669 to 69,081.

The economic calendar doesn't contain any UK statistics today, so don't be surprised if GBP/USD continues to lose ground, especially amid speculations that the Federal Reserve will go ahead with rate hikes this autumn. I expect the buyers to assert themselves only in the area of the nearest support 1.2028. A false breakout there will generate an entry point. GBP/USD aims to grow towards the intermediate resistance of 1.2079, formed following the results of yesterday.
Only a breakout and test from top to bottom of this level will provide at least some chance of recovery. GBP/USD will form a buy signal, enabling an upward correction and allowing the price to reach new resistance of 1.2118, where the moving averages are located, playing on the sellers' side. If the instrument goes above this level, we can talk about a push to 1.2163 where I will take profits. In case of a further fall in GBP/USD and a lack of buyers at 1.2028 which is a highly realistic scenario, the pressure on the pound will increase. If this happens, I will postpone long positions until 1.1970. Traders will buy there only on a false breakout. You can open long positions on GBP/USD immediately on a dip from 1.1927, bearing in mind an intraday correction of 30-35 pips.
What is needed to open short positions on GBP/USD
The bears did everything they needed to do yesterday. Today in the first half of the day, it would be nice to see the protection of the intermediate resistance at 1.2079. A false breakout at this level will confirm the presence of large sellers in the market, which will provide a signal to sell in anticipation of a further decline in GBP/USD and the renewal of support at 1.2028. A breakout and reverse test from the bottom to the top of this level will reinforce the bears' advantage, providing a short entry point to update 1.1970. A lower target will be 1.1927, where I will take profits. If GBP/USD grows and there are no bears at 1.2079, the bulls will try to enable an upward correction, which will lead the price upward to the next resistance at 1.2118. If there is no activity there, I advise you to sell GBP/USD from 1.2163, bearing in mind an intraday 30-35-pips correction downwards.
Indicators' signals
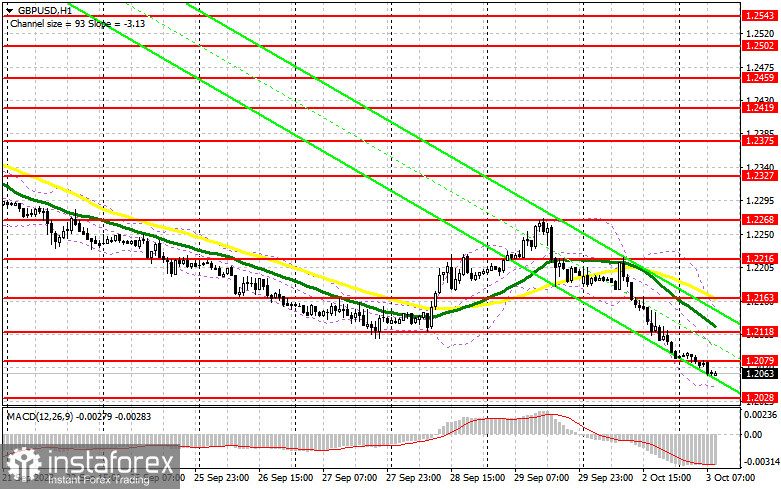
Moving Averages
The instrument is trading below the 30 and 50-day moving averages. It indicates that GBP/USD is likely to decline lower.
Note: The period and prices of the moving averages are considered by the analyst on the 1-hour chart and differ from the general definition of classic daily moving averages on the daily chart.
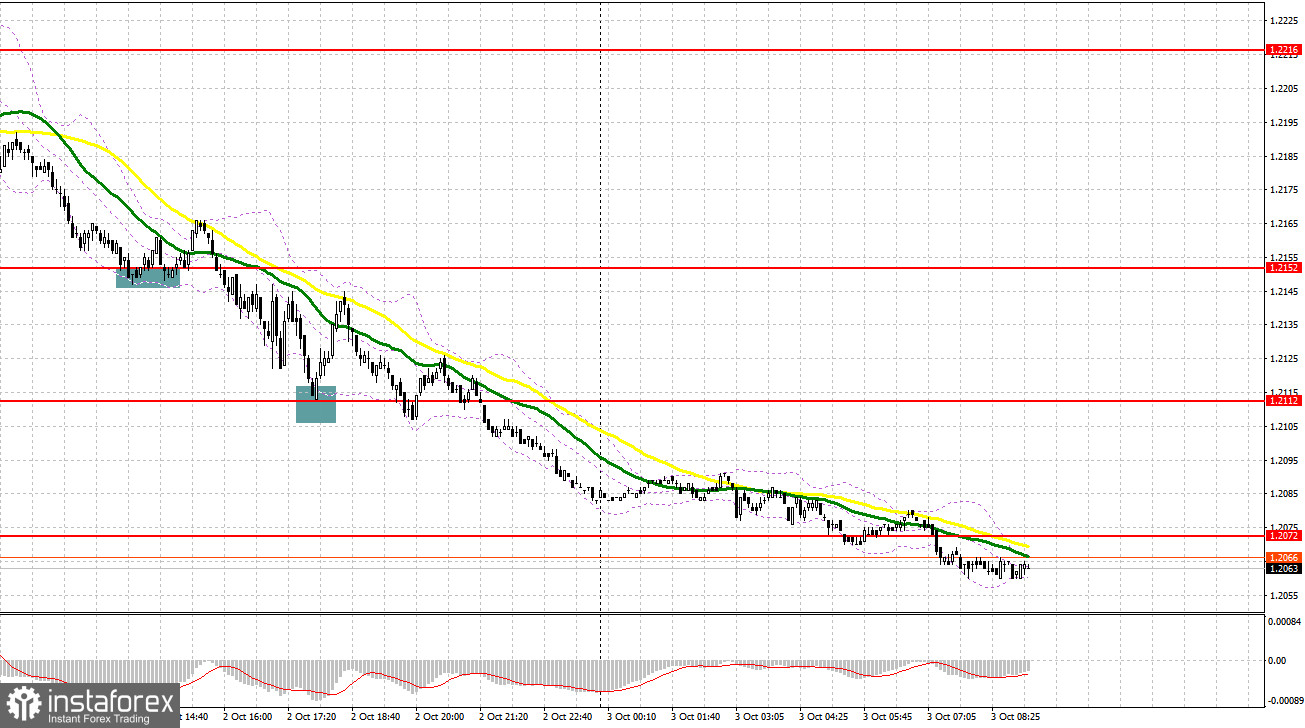
Bollinger Bands
In case GBP/USD goes up, the indicator's upper border at about 1.2150 will act as resistance. Alternatively, if the instrument declines, the indicator's lower border at 1.2050 will serve as support.
Description of indicators
- Moving average (moving average, determines the current trend by smoothing out volatility and noise). Period 50. It is marked yellow on the chart.
- Moving average (moving average, determines the current trend by smoothing out volatility and noise). Period 30. It is marked green on the chart.
- MACD indicator (Moving Average Convergence/Divergence — convergence/divergence of moving averages) Quick EMA period 12. Slow EMA period to 26. SMA period 9
- Bollinger Bands (Bollinger Bands). Period 20
- Non-commercial speculative traders, such as individual traders, hedge funds, and large institutions that use the futures market for speculative purposes and meet certain requirements.
- Long non-commercial positions represent the total long open position of non-commercial traders.
- Short non-commercial positions represent the total short open position of non-commercial traders.
- Total non-commercial net position is the difference between short and long positions of non-commercial traders.