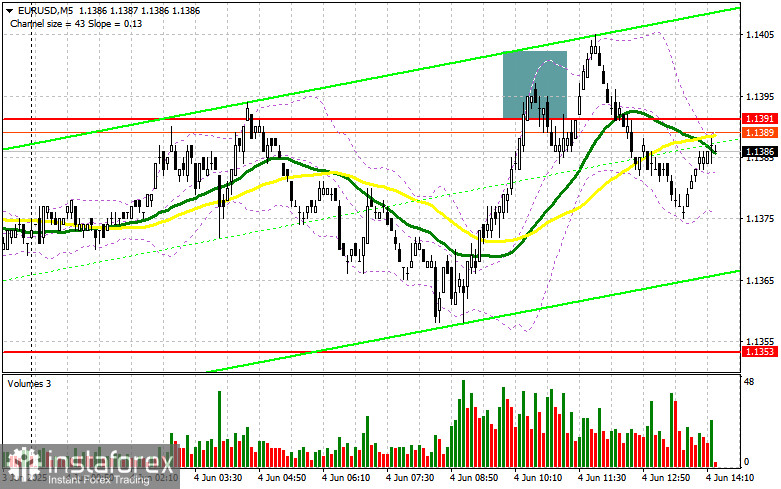
In my morning forecast, I focused on the 1.1391 level and planned to base trading decisions around it. Let's look at the 5-minute chart and analyze what happened. A rise and formation of a false breakout near 1.1391 provided an entry point for selling the euro, but as you can see on the chart, there was no significant decline in the pair. The technical picture was revised for the second half of the day.
To Open Long Positions on EUR/USD:
PMI data for all eurozone countries except Germany for May were revised upward, which restored bullish momentum to the EUR/USD pair — although it didn't lead to a major upward move. There is still plenty of data ahead that could change the situation. Attention will turn to the ADP employment change data for May, as well as the U.S. services PMI and composite PMI. The day will end with speeches by FOMC members Raphael Bostic and Lisa D. Cook. In case of a decline on strong data, focus will shift to defending the 1.1361 support, formed during the first half of the day. A false breakout there would be a signal to buy EUR/USD, aiming for an update of the high around 1.1413. A breakout and retest of this range would confirm a proper entry point, with a move toward the 1.1453 area. The ultimate target would be 1.1490, where I would take profits.
If EUR/USD declines and there is no buying activity around 1.1361, pressure on the pair will return, leading to a larger drop. In that case, bears could push the pair down to 1.1314. Only after a false breakout form would I consider buying the euro. Alternatively, I would open long positions immediately on a rebound from 1.1270, aiming for an intraday upward correction of 30–35 points.
To Open Short Positions on EUR/USD:
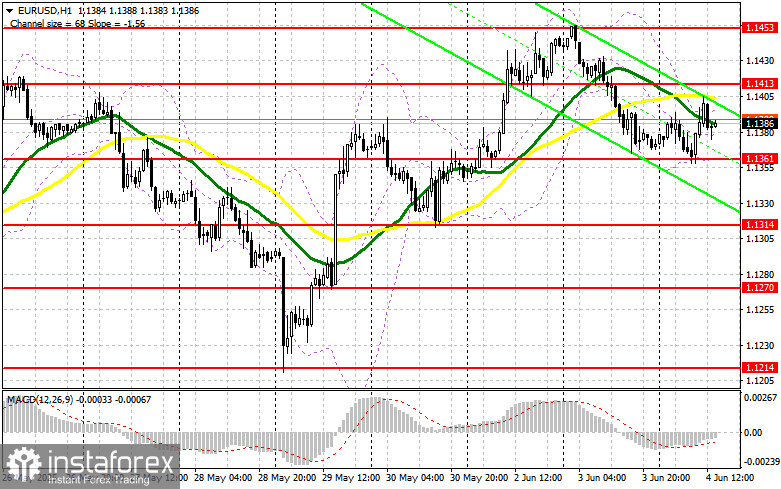
Sellers did everything they could in the first half of the day, but it wasn't enough to resume the downward trend in the euro. At the same time, it's hard to say that pressure on the euro has fully returned. It's better to wait for the U.S. statistics and the market's reaction before making any decisions.
A false breakout near the 1.1413 resistance will be a signal to sell, aiming for a drop toward 1.1361 support. A breakout and consolidation below this range will be a suitable scenario for selling, targeting 1.1314. The ultimate target would be 1.1270, where I would take profits.
If EUR/USD rises in the second half of the day and there is no active bearish action around 1.1413, where moving averages (favoring the bears) are also located slightly below, buyers could achieve a larger rally and update 1.1453. I would only sell after a failed consolidation at this level. Alternatively, I plan to open short positions immediately on a rebound from 1.1490, targeting a 30–35 point downward correction.
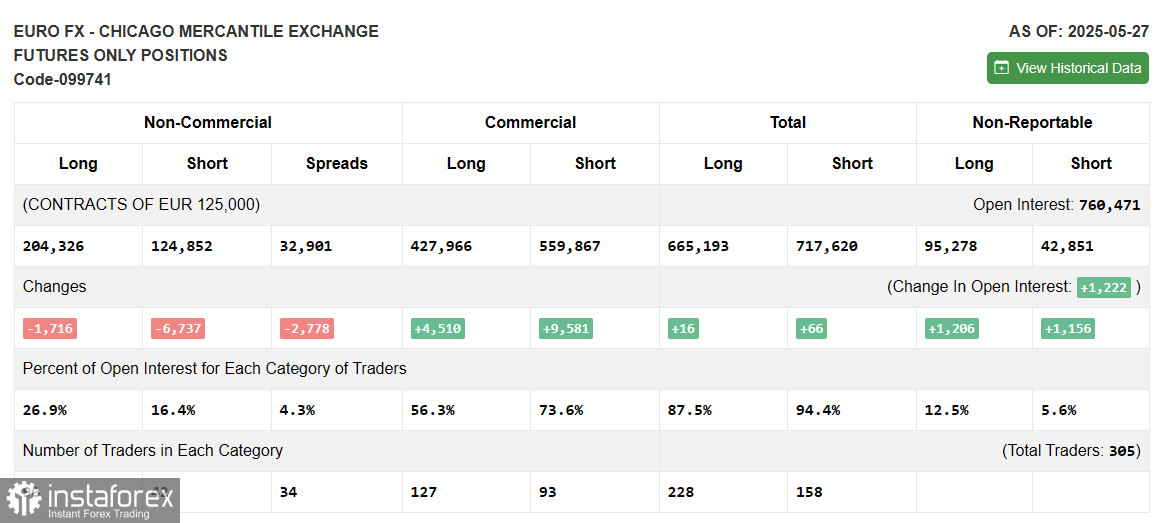
The COT (Commitments of Traders) report for May 27 showed a reduction in both long and short positions. However, the advantage still lies with the buyers. Traders are preparing for the next ECB meeting, where another rate cut is expected. However, many economists believe this could be the last cut before the regulator pauses for an extended period, potentially strengthening the euro in the short term. Add to that the upcoming U.S. GDP and labor market reports, and the week promises to be quite intense.
According to the COT report, long non-commercial positions decreased by 1,716 to 204,326. Short non-commercial positions fell by 6,737 to 124,852. Thus, the gap between long and short positions narrowed by 2,778.
Indicator Signals:
Moving Averages:Trading is occurring below the 30- and 50-period moving averages, indicating a decline in the euro.
Note: The period and prices of the moving averages are based on the author's analysis of the H1 chart and differ from the classical daily moving averages on the D1 chart.
Bollinger Bands:
In the event of a decline, the lower boundary of the indicator around 1.1361 will act as support.
Indicator Descriptions:
- Moving Average: Defines the current trend by smoothing out volatility and noise. 50-period (marked in yellow); 30-period (marked in green)
- MACD (Moving Average Convergence/Divergence): Fast EMA – 12-period; Slow EMA – 26-period; SMA – 9-period
- Bollinger Bands: 20-period
- Non-commercial traders: Speculators like individual traders, hedge funds, and large institutions using the futures market for speculative purposes
- Long non-commercial positions: Total long open positions held by non-commercial traders
- Short non-commercial positions: Total short open positions held by non-commercial traders
- Net non-commercial position: The difference between short and long positions among non-commercial traders