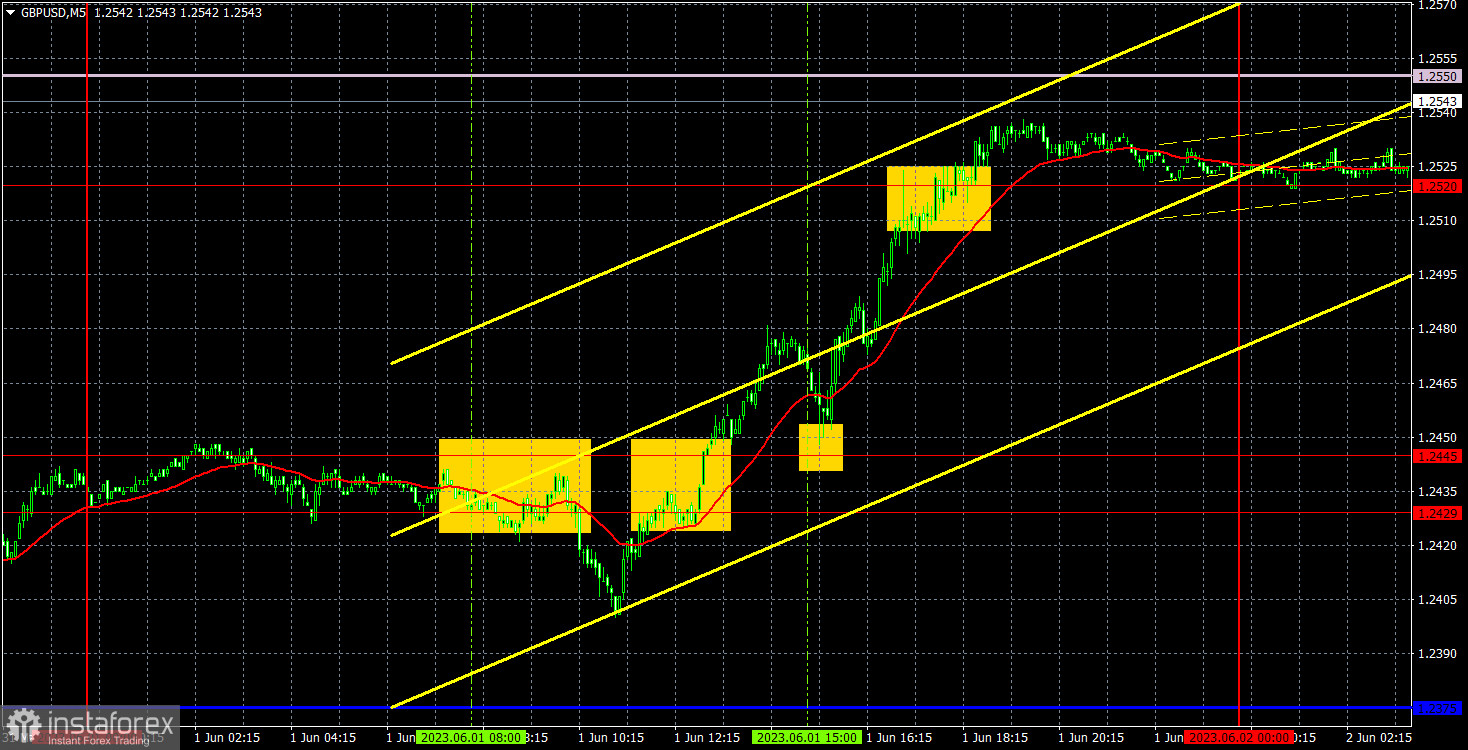
empty
02.06.2023 08:32 AM
GBP/USD: Forecast and trading signals on June 2, 2023. COT report. Detailed analysis of price movement and trades. The market is buying up the pound again

5M chart of GBP/USD

This image is no longer relevant

On Thursday, the GBP/USD pair grew "out of nowhere" again. And it was an impressive one at that. Take note that there was no significant news from the UK this week. If, for example, the Bank of England had made hawkish statements, the movement would have been understandable. However, all the data that influenced the market came from overseas, and many of them favored the dollar. The situation with the euro is slightly different, which explains its growth. After all, yesterday and the day before that, several important reports were released in the EU, two speeches by European Central Bank President Christine Lagarde took place, and the ECB minutes were published. But it is very difficult to say why the pound is rising again.

However, we did experience a good intraday trending movement yesterday, which made the trading signals strong and profitable. Initially, the pair consolidated below the range of 1.2429-1.2445 and managed to move down by about 20 pips, allowing for setting a stop loss at breakeven and leaving the trade without losses when the pair consolidated above the mentioned range. Based on the buy signal, long positions should have been opened, and the price subsequently surpassed the nearest target level of 1.2520. The trade should have been manually closed in the evening, resulting in a profit of about 75 pips, which is quite good. But let's reiterate: it is convenient to trade when there is a strong and trend-driven movement. It is necessary to avoid flat markets.
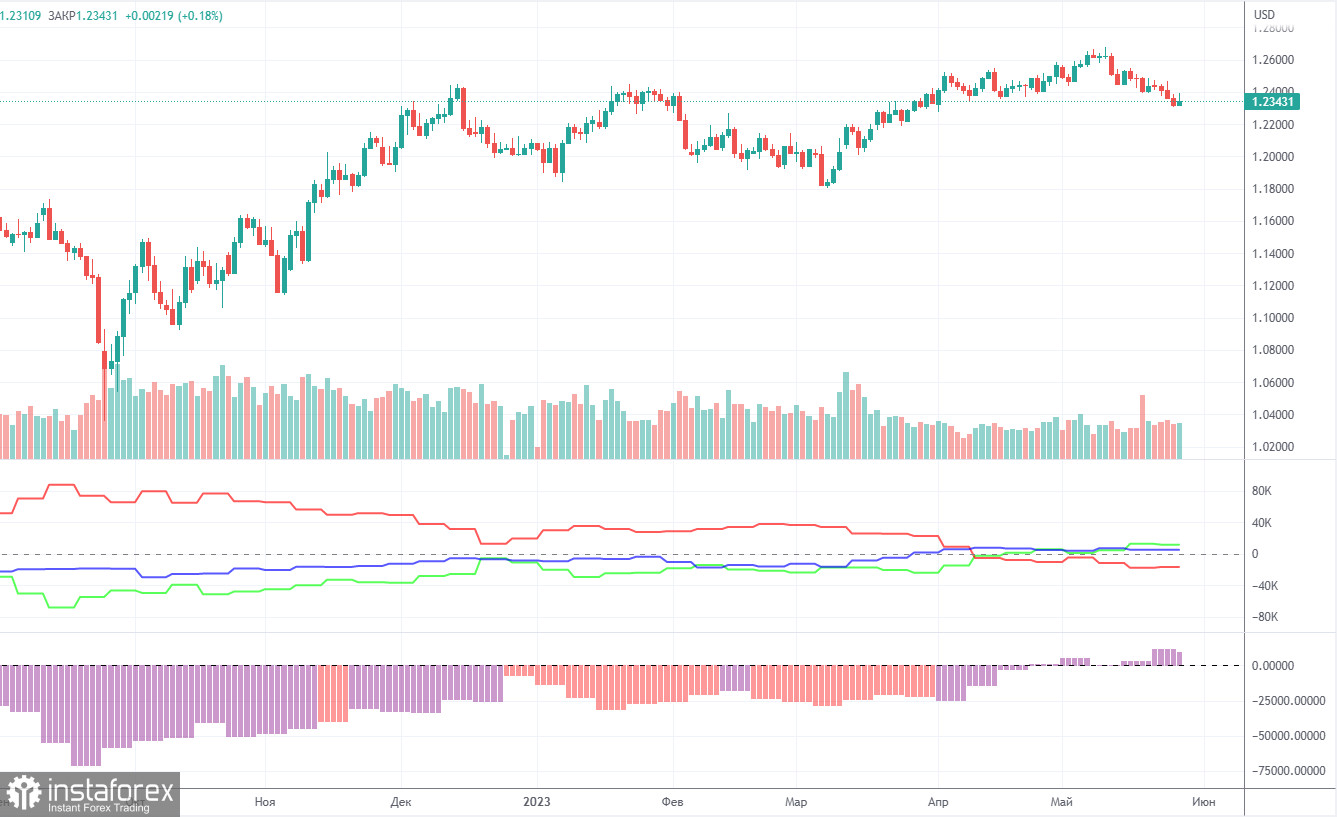
COT report:

This image is no longer relevant

According to the latest report, non-commercial traders closed 8,100 long positions and 7,100 short ones. The net position dropped by 1,000 but remained bullish. Over the past 9-10 months, the net position has been on the rise despite bearish sentiment. The pound is bullish against the greenback in the medium term, but there have been hardly any reasons for that. We assume that a prolonged bear run has begun. COT reports suggest a bullish continuation. However, we can hardly explain why the uptrend should go on.

Both major pairs are in correlation now. At the same time, the positive net position on EUR/USD shows the end of the uptrend. Meanwhile, the net position on GBP/USD is neutral. The pound has gained about 2,300 pips. Therefore, a bearish correction is now needed. Otherwise, a bullish continuation would make no sense even despite the lack of support from fundamental factors. Overall, non-commercial traders hold 57,600 sell positions and 69,200 long ones. We do not see the pair extending growth in the long term.
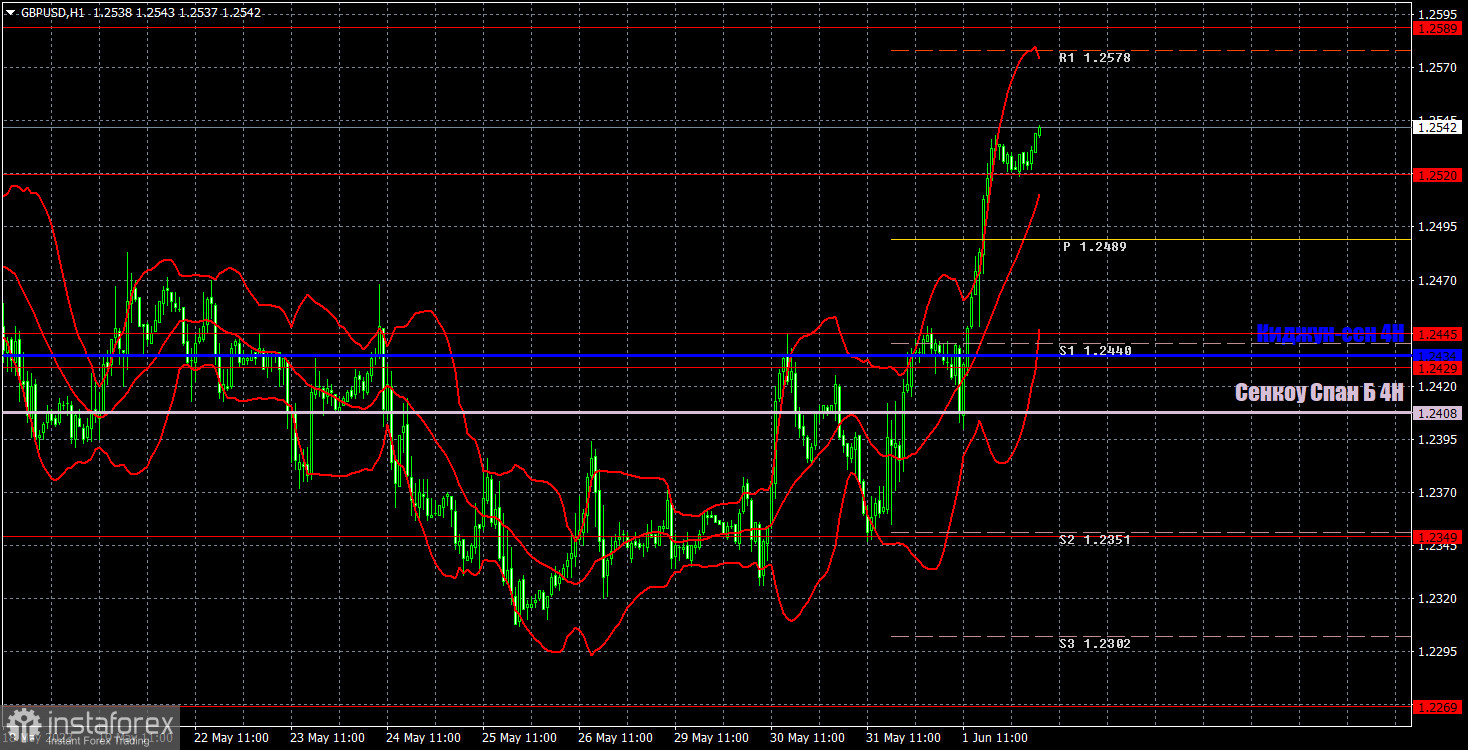
1H chart of GBP/USD

This image is no longer relevant

In the 1-hour time frame, the pair has started an upward movement, surpassing all the lines of the Ichimoku indicator. The pound doesn't exactly have grounds to buy the pound, which remains heavily overbought. However, take note that the market has the right to trade regardless of the fundamental and macroeconomic backdrop. The only thing I can say is that the movement doesn't correspond to the nature of the reports and news.

On June 2, trading levels are seen at 1.2269, 1.2349, 1.2429-1.2445, 1.2520, 1.2589, 1.2666, 1.2762. Senkou Span B (1.2550) and Kijun-sen (1.2375) lines may also generate signals when the price either breaks or bounces off them. A Stop Loss should be placed at the breakeven point when the price goes 20 pips in the right direction. Ichimoku indicator lines can move intraday, which should be taken into account when determining trading signals. There are also support and resistance which can be used for locking in profits.

Today, the event calendar is empty in the UK. On the other hand, the United States will release its highly anticipated Nonfarm Payrolls and unemployment reports. We have no doubt that the market will react to them, and the reaction could be practically anything - it is currently impossible to predict the values of the reports.

Indicators on charts:

Resistance/support - thick red lines, near which the trend may stop. They do not make trading signals.

The Kijun-sen and Senkou Span B lines are the Ichimoku indicator lines moved to the hourly timeframe from the 4-hour timeframe. They are also strong lines.

Extreme levels are thin red lines, from which the price used to bounce earlier. They can produce trading signals.

Yellow lines are trend lines, trend channels, and other technical patterns.

Indicator 1 on the COT chart is the size of the net position of each trader category.

Indicator 2 on the COT chart is the size of the net position for the Non-commercial group of traders.

Paolo Greco,
Especialista em análise na InstaForex
© 2007-2025
Selecionar intervalo de tempo
5
min
15
min
30
min
1
hora
4
horas
1
dia
1
s.
Ganhe com as variações das taxas das criptomoedas com a InstaForex.
Baixe o MetaTrader 4 e abra a sua primeira operação.
  • Grand Choice
    Contest by
    InstaForex
    InstaForex always strives to help you
    fulfill your biggest dreams.
    PARTICIPE DO CONCURSO

Recommended Stories

Como negociar o par EUR/USD em 19 de maio? Dicas simples e análise de negociação para iniciantes

Análise das negociações de sexta-feira Gráfico 1H do EUR/USD Na sexta-feira, o par EUR/USD registrou uma queda significativa, apesar da ausência de fatores macroeconômicos ou fundamentais claros. Ainda assim

Paolo Greco 17:02 2025-05-19 UTC+2

Ideia de negociação para a queda do EUR/USD

Após o forte momentum de baixa de sexta-feira, o instrumento entrou em uma correção de alta e, no momento, está testando a zona de ruptura curta, a partir da qual

Andrey Shevchenko 17:32 2025-05-05 UTC+2

Ideia de negociação para a queda do GBP/USD

Após o forte movimento de baixa de curto prazo observado na sexta-feira, o par entrou em uma correção de alta e, neste momento, está testando uma zona de ruptura

Andrey Shevchenko 16:01 2025-05-05 UTC+2

EUR/USD: Plano de Negociação para a Sessão dos E.U.A. de 30 de abril (Revisão das Negociações da Manhã)

Na minha previsão matinal, destaquei o nível 1,1378 e planejei basear as decisões de entrada no mercado nele. Vamos dar uma olhada no gráfico de 5 minutos e analisar

Miroslaw Bawulski 14:52 2025-04-30 UTC+2

EUR/USD: Plano de Negociação para a Sessão dos E.U. de 24 de abril (Revisão das Negociações da Manhã)

Na minha previsão matinal, concentrei-me no nível 1,1358 e planejei tomar decisões de negociação com base nele. Vamos dar uma olhada no gráfico de 5 minutos para entender

Miroslaw Bawulski 21:48 2025-04-24 UTC+2

Como negociar o par EUR/USD em 22 de abril? Dicas simples e análise de negociação para iniciantes

Análise das operações de segunda-feira Gráfico 1H do EUR/USD O par EUR/USD iniciou a segunda-feira com uma forte recuperação. Durante a madrugada, o euro avançou entre 100 e 120 pips

Paolo Greco 15:10 2025-04-22 UTC+2

Como negociar o par GBP/USD em 11 de abril? Dicas simples e análise de negociação para iniciantes

Análise das operações de quinta-feira Gráfico 1H do GBP/USD Nas últimas 24 horas, o par GBP/USD avançou 170 pips, e a valorização da libra esterlina continuou durante a madrugada desta

Paolo Greco 16:46 2025-04-11 UTC+2

Como negociar o par GBP/USD em 7 de abril? Dicas simples e análise de negociação para iniciantes

Análise das operações de sexta-feira Gráfico 1H do GBP/USD O par GBP/USD registrou uma forte correção na sexta-feira, um movimento difícil de justificar — mesmo com a vantagem da retrospectiva

Paolo Greco 16:28 2025-04-07 UTC+2

Como negociar o par EUR/USD em 7 de abril? Dicas simples e análise de negociação para iniciantes

Análise das operações de sexta-feira Gráfico 1H de EUR/USD O par EUR/USD permaneceu sob forte instabilidade nesta sexta-feira. Desta vez, o movimento de baixa predominou — mas isso não tornou

Paolo Greco 15:51 2025-04-07 UTC+2

EUR/USD: Plano de Negociação para a Sessão dos E.U.A de 4 de Abril (Revisão das Negociações da Manhã)

Na minha previsão matinal, destaquei o nível 1,0994 e planejei basear minhas decisões de entrada no mercado nele. Vamos dar uma olhada no gráfico de 5 minutos e analisar

Miroslaw Bawulski 19:56 2025-04-04 UTC+2
Não pode falar agora?
Faça sua pergunta no chat.
Widget callback
 

Dear visitor,

Your IP address shows that you are currently located in the USA. If you are a resident of the United States, you are prohibited from using the services of InstaFintech Group including online trading, online transfers, deposit/withdrawal of funds, etc.

If you think you are seeing this message by mistake and your location is not the US, kindly proceed to the website. Otherwise, you must leave the website in order to comply with government restrictions.

Why does your IP address show your location as the USA?

  • - you are using a VPN provided by a hosting company based in the United States;
  • - your IP does not have proper WHOIS records;
  • - an error occurred in the WHOIS geolocation database.

Please confirm whether you are a US resident or not by clicking the relevant button below. If you choose the wrong option, being a US resident, you will not be able to open an account with InstaForex anyway.

We are sorry for any inconvenience caused by this message.