empty
20.09.2023 05:13 AM
Trading plan for EUR/USD on September 20. Simple tips for beginners

Analyzing Tuesday's trades:

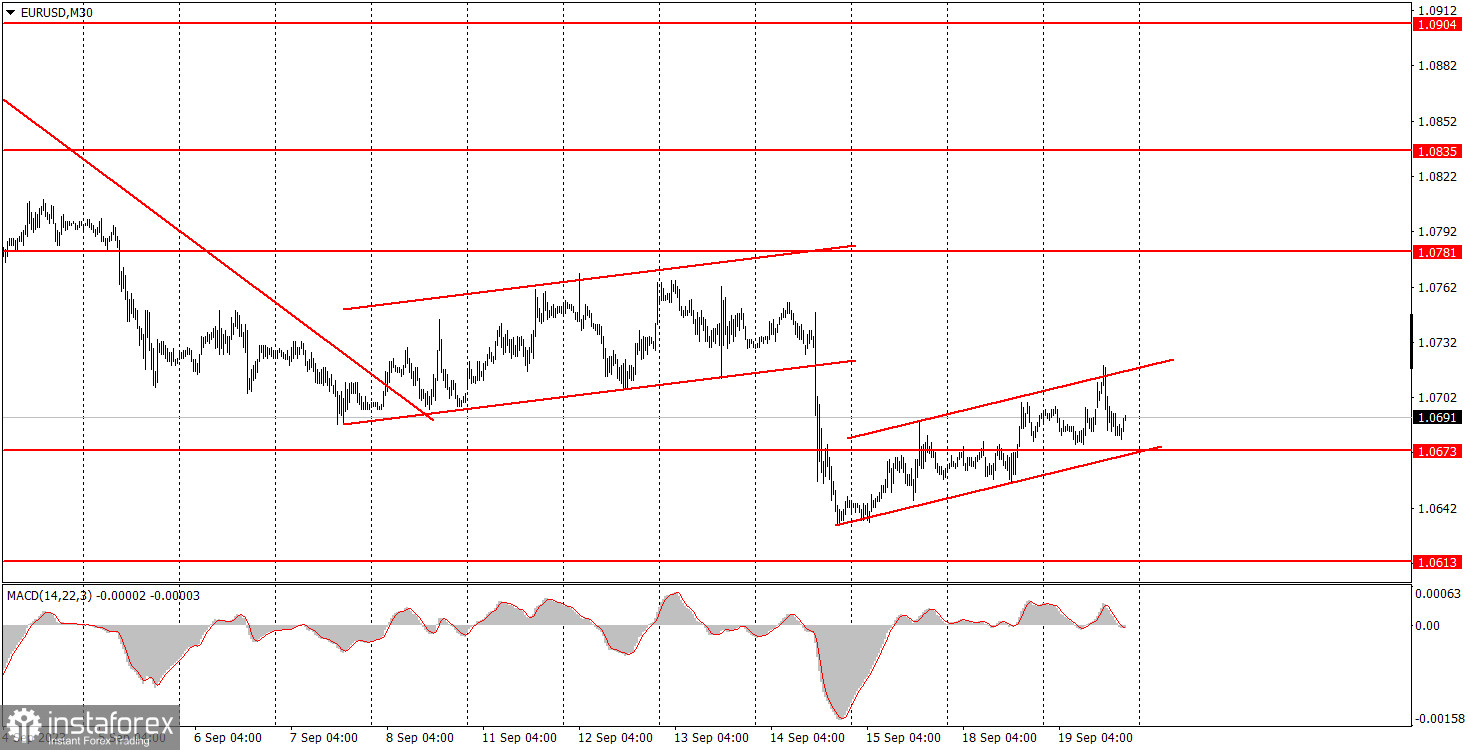
EUR/USD on 30M chart

This image is no longer relevant

EUR/USD did not show any distinct changes in its movement on Tuesday. We intentionally reduced the chart's scale so that traders could see that the pair has been trying to edge up for the past two weeks, but each time it does, it has been weak. Over the past three days, the pair showed positive trades and has managed to cover a distance of 70-80 pips during this time. This is all you need to know about the current volatility of the pair. There have been no changes in the fundamental and macroeconomic background either. The European Union released the final estimate of its inflation report for August, and it turned out to be 0.1% lower than the expected 5.3%. However, this report had no impact on the euro's movement.

At the beginning of the US trading session, the report on building permits issued in the United States was published, and the number of permits exceeded expectations. As a result, the dollar briefly strengthened by 30 pips over half an hour. However, these 30 pips had virtually no impact. There is a slight uptrend and even a channel in place, but volatility was so weak that it is practically impossible to trade with this pair.

EUR/USD on 5M chart

This image is no longer relevant

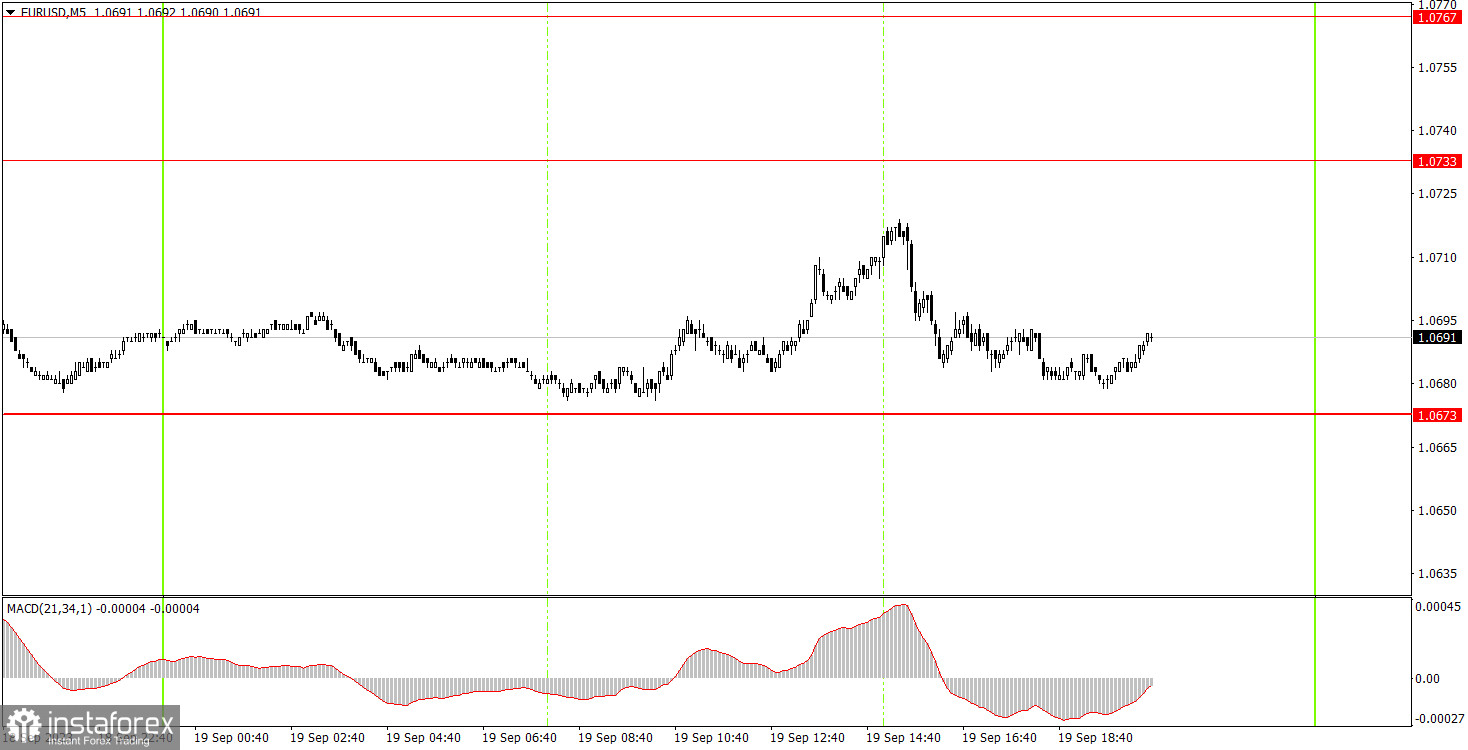
On the 5-minute chart, you can clearly see what we meant when we said that it was impossible to trade this pair. The price moved 43 pips from the low to the high. There were no trading signals. Even if a buy signal had been formed around the 1.0673 level at the beginning of the European session, it would not have had any impact, and beginners would not have made any profit. Therefore, it's a good thing that there were no trading signals on Tuesday – in a flat market or with weak volatility, they are often false.

Trading tips on Wednesday:

On the 30-minute chart, EURUSD started a weak correction. The euro still lacks robust bullish indicators. In the medium term, we anticipate the euro's further decline, but on Wednesday evening, the results of the FOMC meeting will be announced, so the volatility may gradually increase. The key levels on the 5M chart are 1.0517-1.0533, 1.0607-1.0613, 1.0673, 1.0733, 1.0767-1.0781, 1.0835, 1.0871, 1.0901-1.0904. A stop loss can be set at a breakeven point as soon as the price moves 15 pips in the right direction. On Wednesday, we can expect six speeches from European Central Bank officials, but they can all be considered secondary of importance since five or six members of the monetary committee have already spoken in the first half of the week. In the evening, the results of the FOMC meeting will be announced, followed by a press conference with Federal Reserve Chairman Jerome Powell.

Basic trading rules:

1) The strength of the signal depends on the time period during which the signal was formed (a rebound or a break). The shorter this period, the stronger the signal.

2) If two or more trades were opened at some level following false signals, i.e. those signals that did not lead the price to Take Profit level or the nearest target levels, then any consequent signals near this level should be ignored.

3) During the flat trend, any currency pair may form a lot of false signals or do not produce any signals at all. In any case, the flat trend is not the best condition for trading.

4) Trades are opened in the time period between the beginning of the European session and until the middle of the American one when all deals should be closed manually.

5) We can pay attention to the MACD signals in the 30M time frame only if there is good volatility and a definite trend confirmed by a trend line or a trend channel.

6) If two key levels are too close to each other (about 5-15 pips), then this is a support or resistance area.

How to read charts:

Support and Resistance price levels can serve as targets when buying or selling. You can place Take Profit levels near them.

Red lines are channels or trend lines that display the current trend and show which direction is better to trade.

MACD indicator (14,22,3) is a histogram and a signal line showing when it is better to enter the market when they cross. This indicator is better to be used in combination with trend channels or trend lines.

Important speeches and reports that are always reflected in the economic calendars can greatly influence the movement of a currency pair. Therefore, during such events, it is recommended to trade as carefully as possible or exit the market in order to avoid a sharp price reversal against the previous movement.

Beginners should remember that every trade cannot be profitable. The development of a reliable strategy and money management are the key to success in trading over a long period of time.

Paolo Greco,
Especialista em análise na InstaForex
© 2007-2025
Selecionar intervalo de tempo
5
min
15
min
30
min
1
hora
4
horas
1
dia
1
s.
Ganhe com as variações das taxas das criptomoedas com a InstaForex.
Baixe o MetaTrader 4 e abra a sua primeira operação.
  • Grand Choice
    Contest by
    InstaForex
    InstaForex always strives to help you
    fulfill your biggest dreams.
    PARTICIPE DO CONCURSO

Recommended Stories

Como negociar o par EUR/USD em 19 de maio? Dicas simples e análise de negociação para iniciantes

Análise das negociações de sexta-feira Gráfico 1H do EUR/USD Na sexta-feira, o par EUR/USD registrou uma queda significativa, apesar da ausência de fatores macroeconômicos ou fundamentais claros. Ainda assim

Paolo Greco 17:02 2025-05-19 UTC+2

Ideia de negociação para a queda do EUR/USD

Após o forte momentum de baixa de sexta-feira, o instrumento entrou em uma correção de alta e, no momento, está testando a zona de ruptura curta, a partir da qual

Andrey Shevchenko 17:32 2025-05-05 UTC+2

Ideia de negociação para a queda do GBP/USD

Após o forte movimento de baixa de curto prazo observado na sexta-feira, o par entrou em uma correção de alta e, neste momento, está testando uma zona de ruptura

Andrey Shevchenko 16:01 2025-05-05 UTC+2

EUR/USD: Plano de Negociação para a Sessão dos E.U.A. de 30 de abril (Revisão das Negociações da Manhã)

Na minha previsão matinal, destaquei o nível 1,1378 e planejei basear as decisões de entrada no mercado nele. Vamos dar uma olhada no gráfico de 5 minutos e analisar

Miroslaw Bawulski 14:52 2025-04-30 UTC+2

EUR/USD: Plano de Negociação para a Sessão dos E.U. de 24 de abril (Revisão das Negociações da Manhã)

Na minha previsão matinal, concentrei-me no nível 1,1358 e planejei tomar decisões de negociação com base nele. Vamos dar uma olhada no gráfico de 5 minutos para entender

Miroslaw Bawulski 21:48 2025-04-24 UTC+2

Como negociar o par EUR/USD em 22 de abril? Dicas simples e análise de negociação para iniciantes

Análise das operações de segunda-feira Gráfico 1H do EUR/USD O par EUR/USD iniciou a segunda-feira com uma forte recuperação. Durante a madrugada, o euro avançou entre 100 e 120 pips

Paolo Greco 15:10 2025-04-22 UTC+2

Como negociar o par GBP/USD em 11 de abril? Dicas simples e análise de negociação para iniciantes

Análise das operações de quinta-feira Gráfico 1H do GBP/USD Nas últimas 24 horas, o par GBP/USD avançou 170 pips, e a valorização da libra esterlina continuou durante a madrugada desta

Paolo Greco 16:46 2025-04-11 UTC+2

Como negociar o par GBP/USD em 7 de abril? Dicas simples e análise de negociação para iniciantes

Análise das operações de sexta-feira Gráfico 1H do GBP/USD O par GBP/USD registrou uma forte correção na sexta-feira, um movimento difícil de justificar — mesmo com a vantagem da retrospectiva

Paolo Greco 16:28 2025-04-07 UTC+2

Como negociar o par EUR/USD em 7 de abril? Dicas simples e análise de negociação para iniciantes

Análise das operações de sexta-feira Gráfico 1H de EUR/USD O par EUR/USD permaneceu sob forte instabilidade nesta sexta-feira. Desta vez, o movimento de baixa predominou — mas isso não tornou

Paolo Greco 15:51 2025-04-07 UTC+2

EUR/USD: Plano de Negociação para a Sessão dos E.U.A de 4 de Abril (Revisão das Negociações da Manhã)

Na minha previsão matinal, destaquei o nível 1,0994 e planejei basear minhas decisões de entrada no mercado nele. Vamos dar uma olhada no gráfico de 5 minutos e analisar

Miroslaw Bawulski 19:56 2025-04-04 UTC+2
Não pode falar agora?
Faça sua pergunta no chat.
Widget callback
 

Dear visitor,

Your IP address shows that you are currently located in the USA. If you are a resident of the United States, you are prohibited from using the services of InstaFintech Group including online trading, online transfers, deposit/withdrawal of funds, etc.

If you think you are seeing this message by mistake and your location is not the US, kindly proceed to the website. Otherwise, you must leave the website in order to comply with government restrictions.

Why does your IP address show your location as the USA?

  • - you are using a VPN provided by a hosting company based in the United States;
  • - your IP does not have proper WHOIS records;
  • - an error occurred in the WHOIS geolocation database.

Please confirm whether you are a US resident or not by clicking the relevant button below. If you choose the wrong option, being a US resident, you will not be able to open an account with InstaForex anyway.

We are sorry for any inconvenience caused by this message.