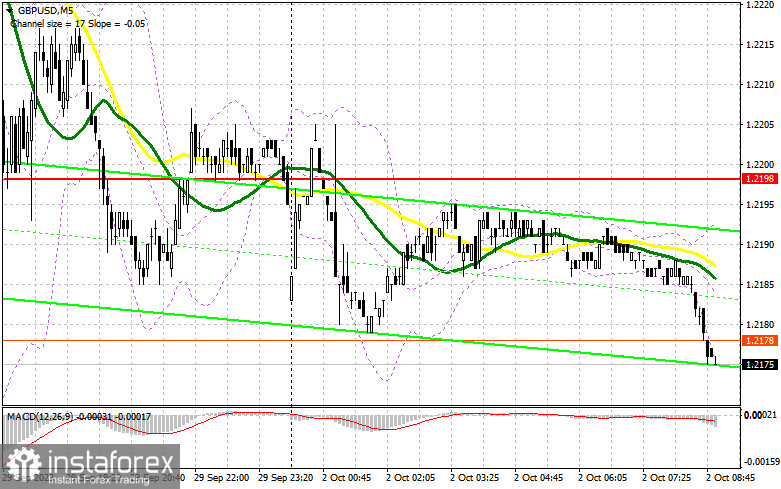
Last Friday, the pair formed just one entry signal. Let's see what happened on the 5-minute chart. In my morning review, I mentioned the level of 1.2247 as a possible entry point. A rise and a false breakout near 1.2247 formed a sell signal, resulting in a movement of almost 20 pips, but a sell-off did not follow. In the afternoon, no other good entry points were formed.
For long positions on GBP/USD:
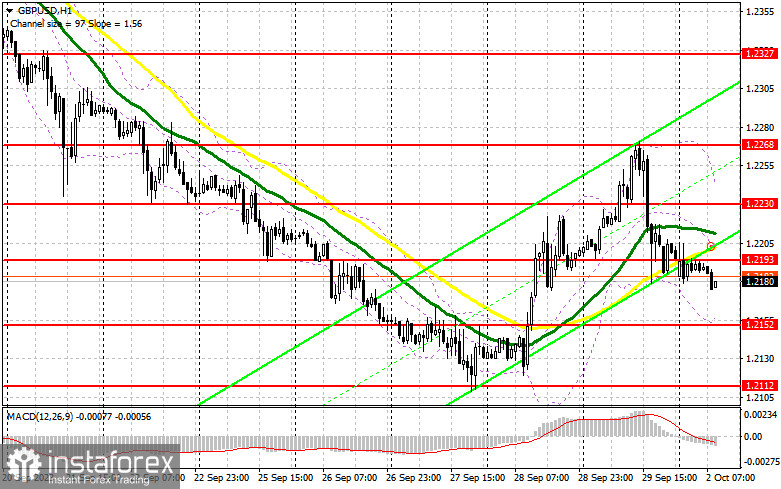
Today a lot will depend on the market's reaction to the UK Manufacturing PMI data. Although it is not as important as the Services PMI, a decline in this gauge will lead to another GBP/USD sell-off, which I intend to capitalize on. I plan to act only near the new low at 1.2152. A false breakout at this level could provide an initial long entry against the bearish trend with a correctional target at the nearest resistance of 1.2193, which is in line with the bearish moving averages. A breakout and stabilization above this range might pave the way for an extended bullish correction, bolstering buyers' confidence. This would signal the opening of long positions targeting 1.2230. The ultimate target would be the 1.2268 area where I'd be looking to take profits. If the pair declines to 1.2152 without buyer activity, bearish pressure on the pound will likely return, opening the path to a low of 1.2112. A false breakout here would signal long entries. I plan to instantly buy GBP/USD on a bounce from the 1.2072 low, aiming for a daily intraday correction of 30-35 pips.
For short positions on GBP/USD:
Bears should guard the nearest resistance at 1.2193, which is intermediate. It is far from certain that the big players will be active in that area. An ideal scenario would be a false breakout at this mark, along with weak Manufacturing PMI, will generate a sell signal with a movement towards the day's low at 1.2152. Breaching this level and subsequently retesting it from below would challenge the bullish sentiment, providing a window to target support at 1.2112 - last month's low. The more distant target remains this month's low at 1.2072, where I'd be taking profits. Should GBP/USD rise and remain unchallenged at 1.2193 (with buyers having all the momentum), I'd postpone short positions until a false breakout at 1.2230 occurs. If there is no downward movement there, I'd sell the pound on an immediate rebound from 1.2268, aiming for a downward correction of 30-35 pips.
COT report:
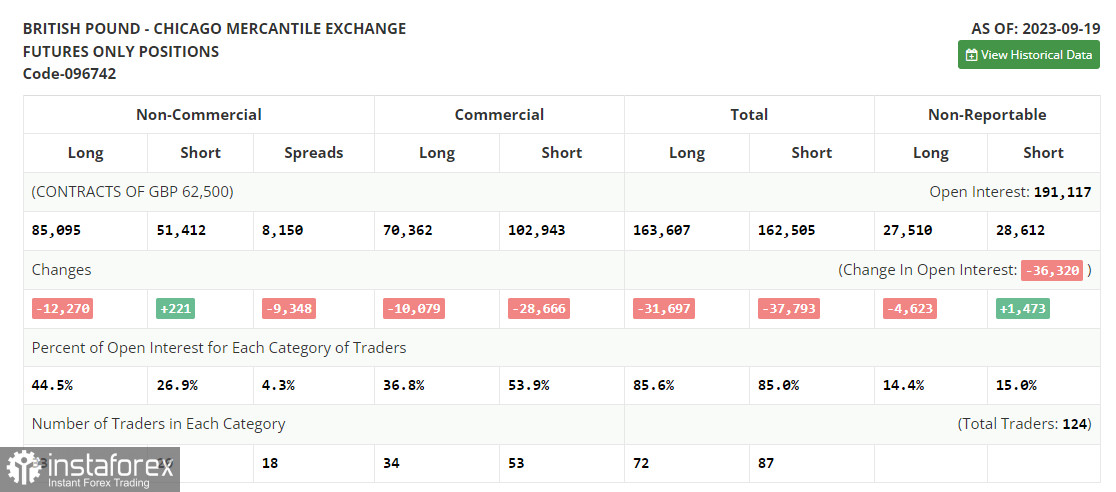
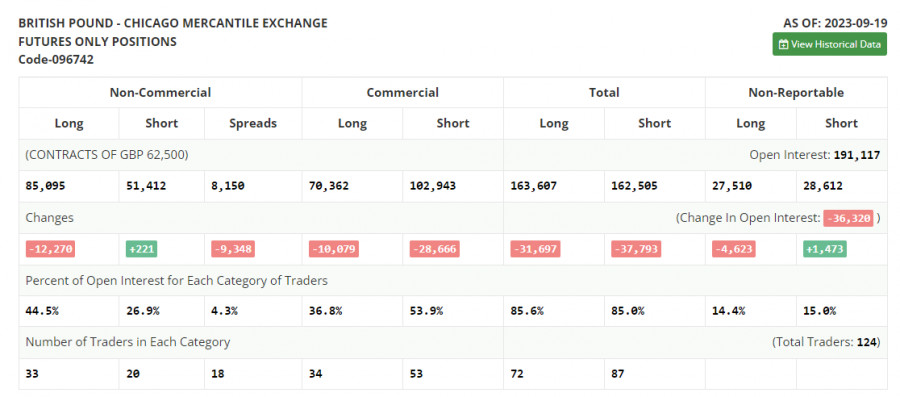
The Commitments of Traders report for September 19 a decline in long positions and a minor increase in short positions. This suggests that while the number of pound buyers is decreasing, there is not a pronounced rise in sellers. Recent data showing a reduction in UK inflation influenced the Bank of England's decision to maintain steady interest rates, surprising many in the process. Traders perceived this news negatively, as it seems the regulator might be at the peak of its interest rate hiking cycle, making the pound less appealing in its current stance. Given the potential for the UK economy to show significant deceleration in Q3, it is no wonder the pound is facing downward pressure against the US dollar. The latest COT report reveals that non-commercial long positions declined by 12,270 to stand at 85,095, while non-commercial short positions increased by only 221, reaching 51,412. Consequently, the spread between long and short positions narrowed by 9,348. The weekly closing price dropped to 1.2390 from 1.2486.
Indicator signals:
Moving Averages
Trading is taking place around the 30-day and 50-day moving averages, indicating a sideways market trend.
Please note that the time period and levels of the moving averages are analyzed only for the H1 chart, which differs from the general definition of the classic daily moving averages on the D1 chart.
Bollinger Bands
If the pair declines, the lower band of the indicator near 1.2152 will act as support.
Description of indicators:
• A moving average of a 50-day period determines the current trend by smoothing volatility and noise; marked in yellow on the chart;
• A moving average of a 30-day period determines the current trend by smoothing volatility and noise; marked in green on the chart;
• MACD Indicator (Moving Average Convergence/Divergence) Fast EMA with a 12-day period; Slow EMA with a 26-day period. SMA with a 9-day period;
• Bollinger Bands: 20-day period;
• Non-commercial traders are speculators such as individual traders, hedge funds, and large institutions who use the futures market for speculative purposes and meet certain requirements;
• Long non-commercial positions represent the total number of long positions opened by non-commercial traders;
• Short non-commercial positions represent the total number of short positions opened by non-commercial traders;
• The non-commercial net position is the difference between short and long positions of non-commercial traders.