empty
15.05.2024 03:09 AM
Outlook for GBP/USD on May 15. The market is not backing away from its core strategy on the pound

Analysis of GBP/USD 5M

This image is no longer relevant

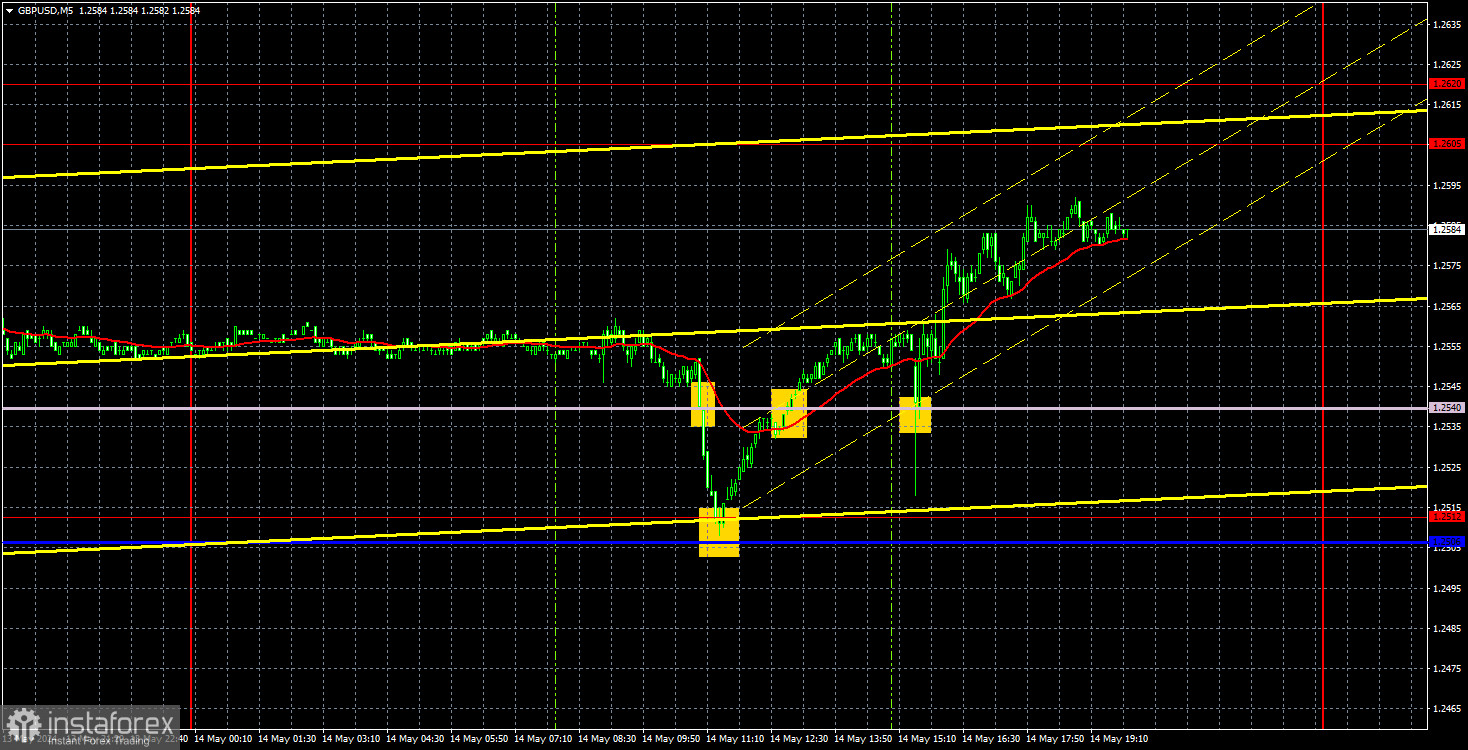
The GBP/USD pair continued to trade higher on Tuesday. The British pound is currently in another sideways channel, this time between the levels of 1.2445 and 1.2605, as clearly seen in the chart. Therefore, the current rise should not be viewed as a trend. The pound is not just appreciating for no reason; it has also been trading in a flat range for months recently. Altogether, this results in "illogical or inconvenient movements" for traders.

Take yesterday, for example. We already analyzed the US Producer Price Index (PPI) in the EUR/USD article and concluded that this report should have likely triggered a decline in both currency pairs, not a rise. However, besides this report, the UK also released its own data. The unemployment rate increased to 4.3%, the number of unemployment benefit claims rose by 8,900, and the average wage growth rate increased to 5.7%. The second and third reports can be seen as positive points for the pound, but the unemployment rate cannot be ignored. The British pound reacted to this data by falling, indicating that traders initially focused on the unemployment rate. However, as with the PPI in the US, sellers eventually retreated.

As soon as the pair started moving, decent trading signals began to appear. All the signals that were marked on the 5-minute timeframe could have been executed. The first sell signal brought no more than 10 pips of profit, but the rebound from the 1.2512 level allowed for a profit of about 60 pips since the pound continued to rise afterward, and no sell signals were formed.

COT report:

This image is no longer relevant

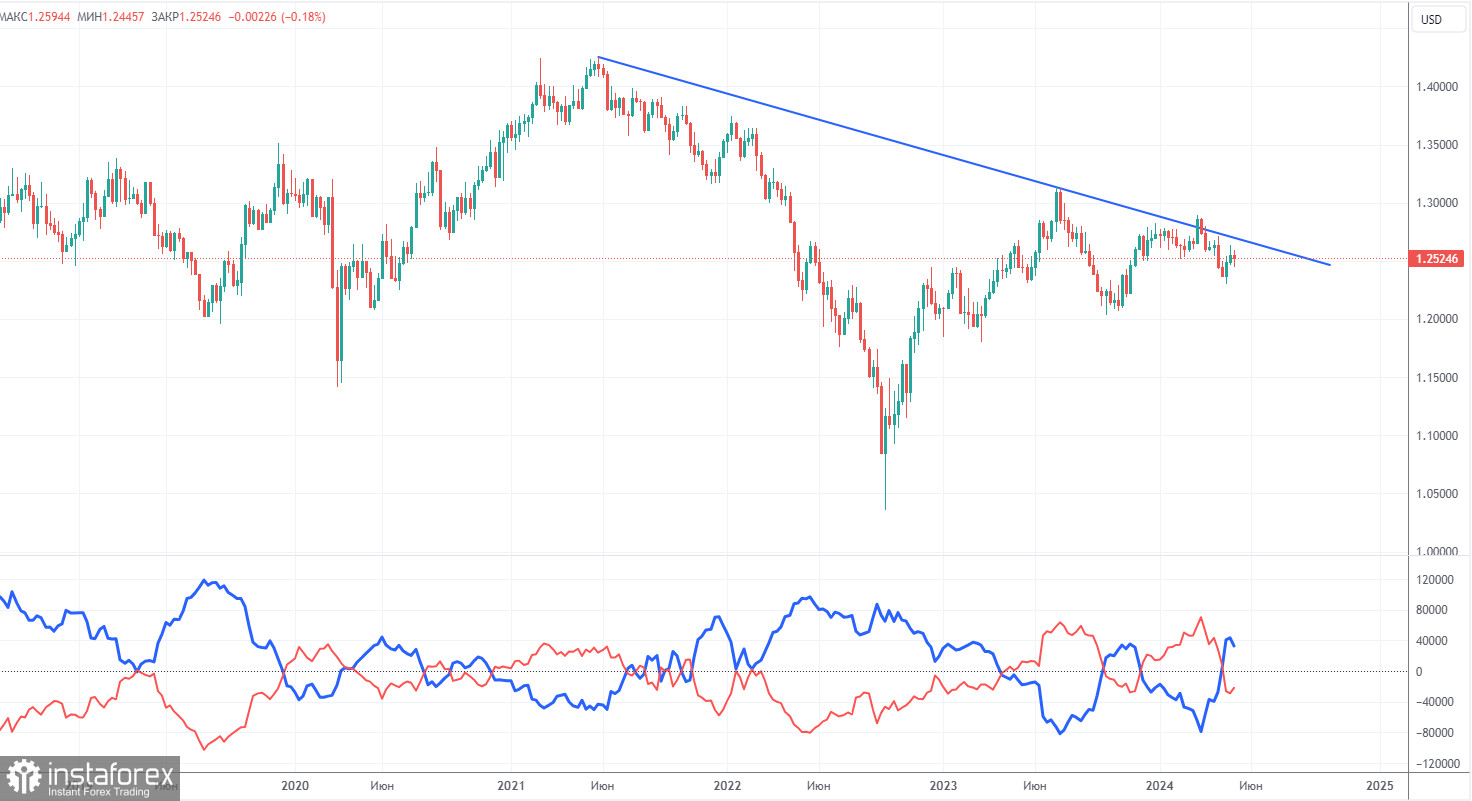
COT reports on the British pound show that the sentiment of commercial traders often changes in recent years. The red and blue lines, which represent the net positions of commercial and non-commercial traders, constantly intersect and, in most cases, remain close to the zero mark. According to the latest report on the British pound, the non-commercial group opened 8,100 buy contracts and 900 short ones. As a result, the net position of non-commercial traders increased by 7,200 contracts in a week. Sellers continue to hold their ground, but they have a small advantage. The fundamental background still does not provide a basis for long-term purchases of the pound sterling, and the currency finally has a real chance to resume the global downward trend. The trend line on the 24-hour TF clearly shows this. Almost all of the factors point to the pound's decline.

The non-commercial group currently has a total of 51,800 buy contracts and 73,600 sell contracts. Now the bears are in control and the pound has a huge potential to fall. We can only hope that inflation in the UK does not accelerate, or that the Bank of England will not intervene.

Analysis of GBP/USD 1H

This image is no longer relevant

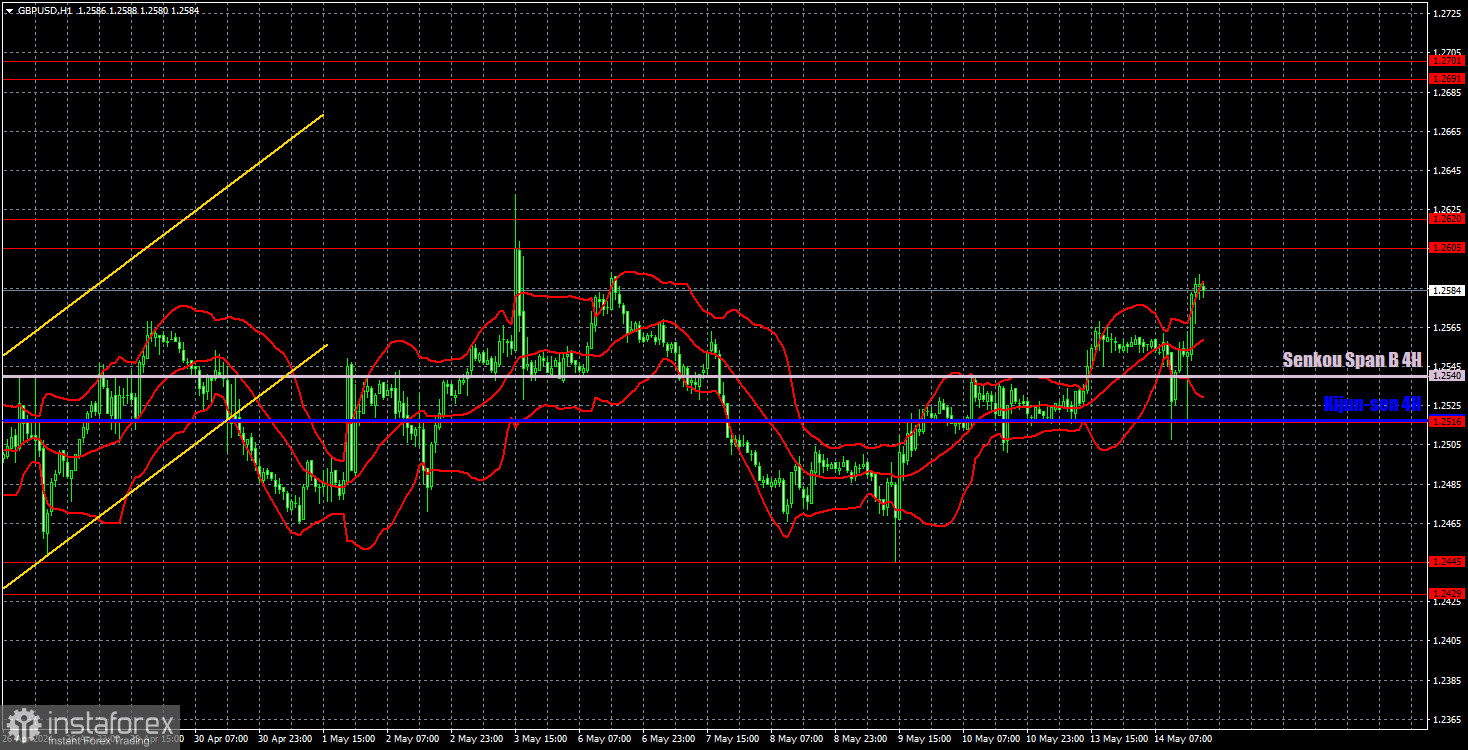
On the 1H chart, GBP/USD continues to go through a bullish correction, which could turn into anything. Since the price could not overcome the area of 1.2605-1.2620, there are hopes of bringing back the downward trend in the medium-term. However, the pound has been trading in a new sideways channel for over a week now. It's hard to imagine how much more time it will spend in the next flat.

As of May 15, we highlight the following important levels: 1.2215, 1.2269, 1.2349, 1.2429-1.2445, 1.2516, 1.2605-1.2620, 1.2691-1.2701, 1.2786, 1.2863, 1.2981-1.2987. The Senkou Span B line (1.2540) and Kijun-sen (1.2518) lines can also serve as sources of signals. Don't forget to set a Stop Loss to breakeven if the price has moved in the intended direction by 20 pips. The Ichimoku indicator lines may move during the day, so this should be taken into account when determining trading signals.

On Wednesday, there are no major events scheduled in the UK. The main event will be the US Consumer Price Index for April. Inflation may slow down by 0.1-0.2%, which could mount pressure on the US dollar, although such values will not mean that the Federal Reserve is approaching monetary policy easing. Therefore, a minor slowdown in inflation is unlikely to change the fundamental background for the dollar.

Description of the chart:

Support and resistance levels are thick red lines near which the trend may end. They do not provide trading signals;

The Kijun-sen and Senkou Span B lines are the lines of the Ichimoku indicator, plotted to the 1H timeframe from the 4H one. They provide trading signals;

Extreme levels are thin red lines from which the price bounced earlier. They provide trading signals;

Yellow lines are trend lines, trend channels, and any other technical patterns;

Indicator 1 on the COT charts is the net position size for each category of traders;

Paolo Greco,
Especialista em análise na InstaForex
© 2007-2025
Selecionar intervalo de tempo
5
min
15
min
30
min
1
hora
4
horas
1
dia
1
s.
Ganhe com as variações das taxas das criptomoedas com a InstaForex.
Baixe o MetaTrader 4 e abra a sua primeira operação.
  • Grand Choice
    Contest by
    InstaForex
    InstaForex always strives to help you
    fulfill your biggest dreams.
    PARTICIPE DO CONCURSO

Recommended Stories

Como negociar o par EUR/USD em 19 de maio? Dicas simples e análise de negociação para iniciantes

Análise das negociações de sexta-feira Gráfico 1H do EUR/USD Na sexta-feira, o par EUR/USD registrou uma queda significativa, apesar da ausência de fatores macroeconômicos ou fundamentais claros. Ainda assim

Paolo Greco 17:02 2025-05-19 UTC+2

Ideia de negociação para a queda do EUR/USD

Após o forte momentum de baixa de sexta-feira, o instrumento entrou em uma correção de alta e, no momento, está testando a zona de ruptura curta, a partir da qual

Andrey Shevchenko 17:32 2025-05-05 UTC+2

Ideia de negociação para a queda do GBP/USD

Após o forte movimento de baixa de curto prazo observado na sexta-feira, o par entrou em uma correção de alta e, neste momento, está testando uma zona de ruptura

Andrey Shevchenko 16:01 2025-05-05 UTC+2

EUR/USD: Plano de Negociação para a Sessão dos E.U.A. de 30 de abril (Revisão das Negociações da Manhã)

Na minha previsão matinal, destaquei o nível 1,1378 e planejei basear as decisões de entrada no mercado nele. Vamos dar uma olhada no gráfico de 5 minutos e analisar

Miroslaw Bawulski 14:52 2025-04-30 UTC+2

EUR/USD: Plano de Negociação para a Sessão dos E.U. de 24 de abril (Revisão das Negociações da Manhã)

Na minha previsão matinal, concentrei-me no nível 1,1358 e planejei tomar decisões de negociação com base nele. Vamos dar uma olhada no gráfico de 5 minutos para entender

Miroslaw Bawulski 21:48 2025-04-24 UTC+2

Como negociar o par EUR/USD em 22 de abril? Dicas simples e análise de negociação para iniciantes

Análise das operações de segunda-feira Gráfico 1H do EUR/USD O par EUR/USD iniciou a segunda-feira com uma forte recuperação. Durante a madrugada, o euro avançou entre 100 e 120 pips

Paolo Greco 15:10 2025-04-22 UTC+2

Como negociar o par GBP/USD em 11 de abril? Dicas simples e análise de negociação para iniciantes

Análise das operações de quinta-feira Gráfico 1H do GBP/USD Nas últimas 24 horas, o par GBP/USD avançou 170 pips, e a valorização da libra esterlina continuou durante a madrugada desta

Paolo Greco 16:46 2025-04-11 UTC+2

Como negociar o par GBP/USD em 7 de abril? Dicas simples e análise de negociação para iniciantes

Análise das operações de sexta-feira Gráfico 1H do GBP/USD O par GBP/USD registrou uma forte correção na sexta-feira, um movimento difícil de justificar — mesmo com a vantagem da retrospectiva

Paolo Greco 16:28 2025-04-07 UTC+2

Como negociar o par EUR/USD em 7 de abril? Dicas simples e análise de negociação para iniciantes

Análise das operações de sexta-feira Gráfico 1H de EUR/USD O par EUR/USD permaneceu sob forte instabilidade nesta sexta-feira. Desta vez, o movimento de baixa predominou — mas isso não tornou

Paolo Greco 15:51 2025-04-07 UTC+2

EUR/USD: Plano de Negociação para a Sessão dos E.U.A de 4 de Abril (Revisão das Negociações da Manhã)

Na minha previsão matinal, destaquei o nível 1,0994 e planejei basear minhas decisões de entrada no mercado nele. Vamos dar uma olhada no gráfico de 5 minutos e analisar

Miroslaw Bawulski 19:56 2025-04-04 UTC+2
Não pode falar agora?
Faça sua pergunta no chat.
Widget callback
 

Dear visitor,

Your IP address shows that you are currently located in the USA. If you are a resident of the United States, you are prohibited from using the services of InstaFintech Group including online trading, online transfers, deposit/withdrawal of funds, etc.

If you think you are seeing this message by mistake and your location is not the US, kindly proceed to the website. Otherwise, you must leave the website in order to comply with government restrictions.

Why does your IP address show your location as the USA?

  • - you are using a VPN provided by a hosting company based in the United States;
  • - your IP does not have proper WHOIS records;
  • - an error occurred in the WHOIS geolocation database.

Please confirm whether you are a US resident or not by clicking the relevant button below. If you choose the wrong option, being a US resident, you will not be able to open an account with InstaForex anyway.

We are sorry for any inconvenience caused by this message.