Analysis of previous deals:
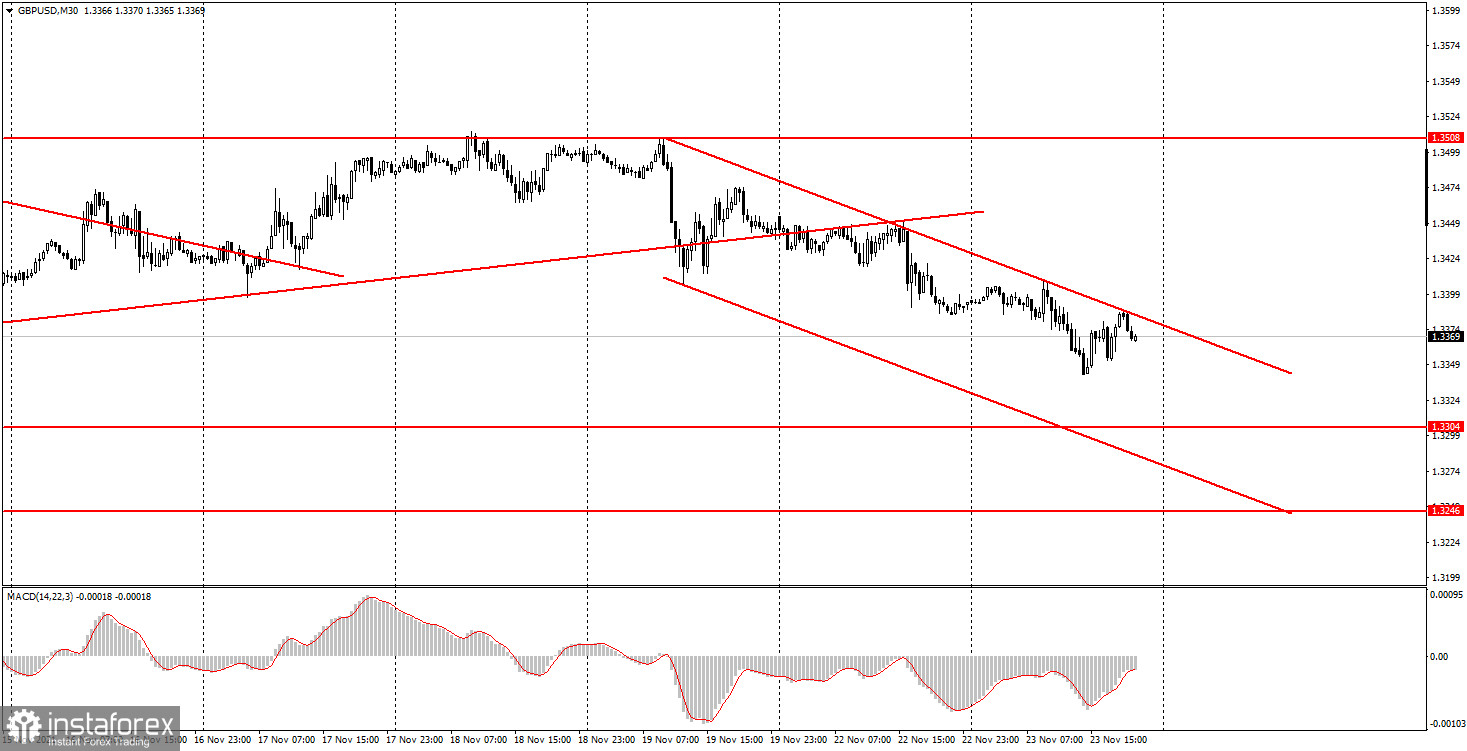
30M chart of the GBP/USD pair
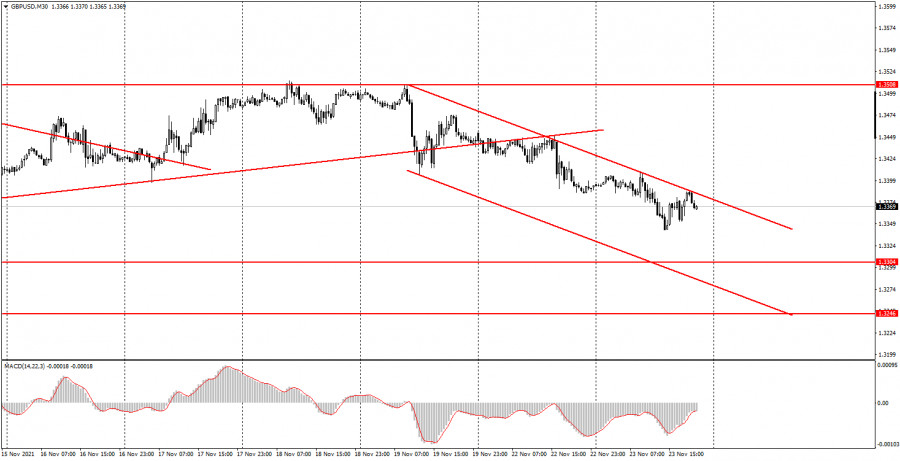
The GBP/USD pair on a 30-minute timeframe on Tuesday, November 23, continued its downward movement after the upward trend line was broken and the price failed to break through the 1.3508 level twice. Thus, the bulls showed their inability to continue buying. Or reluctance. And the British currency fell again. It rushed down so well that a new downward channel was formed almost immediately. Today, for example, the price bounced off it twice, which could be used as sell signals. Until the price settles above this channel, only short positions should be considered, and consolidating above - as a buy signal. It should be noted that the bears also failed to settle below the 1.3351 level (this level is clearly visible in the chart below). We also note that today the US and Great Britain published business activity indices in the services and manufacturing sectors. Since the actual values of these indicators practically did not differ from the predicted ones, there was no reaction (the first two ticks in the chart below). Bank of England Governor Andrew Bailey's speech also did not provide any new information and did not provoke a reaction from the markets.
5M chart of the GBP/USD pair
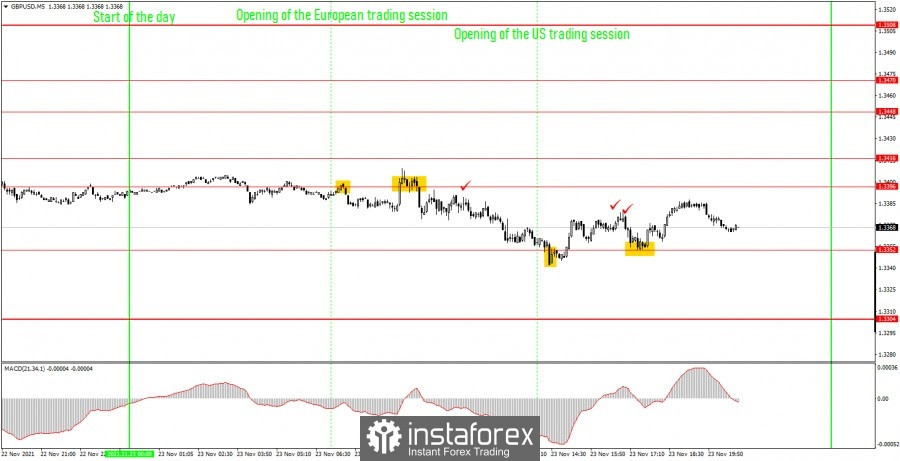
On the 5-minute timeframe, the movement of the pound/dollar pair looks much better. However, only due to the fact that four trading signals were generated and they all look pretty good. The pair's movement itself during the day was far from the best. However, we are more interested in trading signals. The first sell signal was supposed to be the point of novice traders opening short positions. This signal was duplicated within an hour, as the price returned to the 1.3396 level and bounced off it again. This was not the most straightforward moment, since the price slightly went above the 1.3396 level, and the entry point to the deal was much lower. However, it did not formally close above 1.3396, so it was necessary to stay short. Subsequently, the price dropped to the level of 1.3352 and bounced off it. At this point, it was necessary to close short positions (profit of 25 points) and open long positions. In this case, the signal was also duplicated in the form of a second bounce from the level of 1.3352. This deal to buy should have been closed by hand in the late afternoon. The profit on it was about 10-20 points.
How to trade on Wednesday:
At this time, on the 30-minute timeframe, the upward trend has been replaced by a downward one. However, traders now need to overcome the 1.3352 level for the pair to continue falling. Signals can be generated near the upper border of the channel, which can be processed. The important levels on the 5-minute timeframe are 1.3304, 1.3352, 1.3396, 1.3416, 1.3448. We recommend trading on them on Wednesday. The price can bounce off them or overcome them. As before, we set Take Profit at a distance of 40-50 points. At the 5M TF, you can use all the nearest levels as targets, but then you need to take profit, taking into account the strength of the movement. When passing 20 points in the right direction, we recommend setting Stop Loss to breakeven. No major reports will be published in the UK on November 24th. But the United States will be full of important information and events. We recommend that newcomers keep a close eye on the GDP and durable goods orders reports, as well as the evening publication of the Federal Reserve minutes (although by that time all transactions should be closed).
Basic rules of the trading system:
1) The signal strength is calculated by the time it took to form the signal (bounce or overcome the level). The less time it took, the stronger the signal.
2) If two or more deals were opened near a certain level based on false signals (which did not trigger Take Profit or the nearest target level), then all subsequent signals from this level should be ignored.
3) In a flat, any pair can form a lot of false signals or not form them at all. But in any case, at the first signs of a flat, it is better to stop trading.
4) Trade deals are opened in the time period between the beginning of the European session and until the middle of the US one, when all deals must be closed manually.
5) On the 30-minute TF, using signals from the MACD indicator, you can trade only if there is good volatility and a trend, which is confirmed by a trend line or a trend channel.
6) If two levels are located too close to each other (from 5 to 15 points), then they should be considered as an area of support or resistance.
On the chart:
Support and Resistance Levels are the Levels that serve as targets when buying or selling the pair. You can place Take Profit near these levels.
Red lines are the channels or trend lines that display the current trend and show in which direction it is better to trade now.
The MACD indicator consists of a histogram and a signal line. When they cross, this is a signal to enter the market. It is recommended to use this indicator in combination with trend lines (channels and trend lines).
Important speeches and reports (always contained in the news calendar) can greatly influence the movement of a currency pair. Therefore, during their exit, it is recommended to trade as carefully as possible or exit the market in order to avoid a sharp price reversal against the previous movement.
Beginners on Forex should remember that not every single trade has to be profitable. The development of a clear strategy and money management are the key to success in trading over a long period of time.