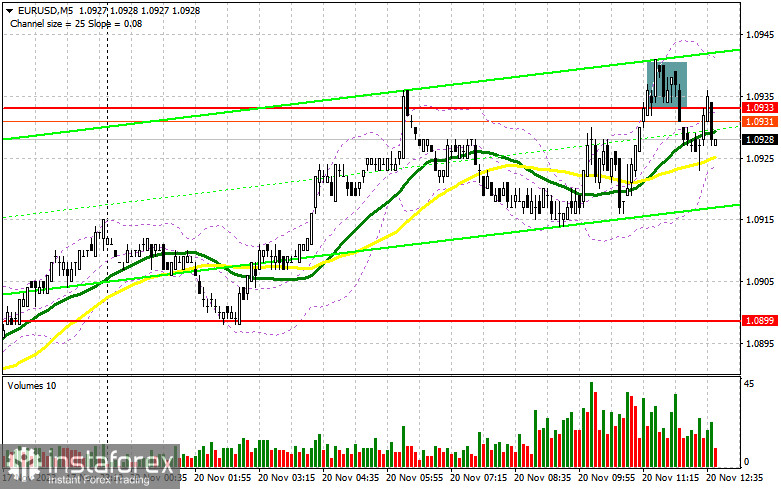
In my morning forecast, I drew attention to the level of 1.0933 and recommended making decisions on market entry based on it. Let's look at the 5-minute chart and analyze what happened there. The rise and the formation of a false breakout at 1.0933 allowed for an excellent entry point for selling in anticipation of a downward movement within the sideways channel that formed in the first half of the day. However, as you can see on the chart, there were no significant market changes due to low volatility. The technical picture remained unchanged for the second half of the day.
To open long positions on EUR/USD, the following is required:
The released data from Germany did not significantly help the euro. We don't have any important statistics ahead, so buyers will retain chances for growth. However, considering how weakly they acted today in the first half of the day near the daily high, a downward correction would be good for entering long positions. For this reason, the optimal option for buying is the level of 1.0899, where the formation of a false breakout will provide a good entry point for long positions, anticipating further pair growth and another test of resistance at 1.0933, formed following the Asian session. A breakthrough and update of this range from top to bottom will provide another buy signal and a chance to update the monthly maximum of around 1.0970. The ultimate target will be the area of 1.1004, where I will take profit. In the scenario of EUR/USD decline and the absence of activity at 1.0899 in the second half of the day, this will not significantly affect buyer affairs. You can always enter the market after forming a false breakout near the next support at 1.0860, where the moving averages, playing on the buyers' side, intersect. I will consider opening long positions immediately on the rebound from 1.0827 with the target of an ascending correction of 30-35 points within the day.
To open short positions on EUR/USD, the following is required:
Sellers have already shown themselves around 1.0933, and as long as trading is conducted below this level, a decline in the euro can be expected to work out the morning sell signal. In case of another upward surge, only the formation of a false breakout at 1.0933, similar to what I analyzed above, will give a sell signal in anticipation of a downward correction and a test of support at 1.0899, where I already expect the appearance of major buyers. After breaking and consolidating below this range and a reverse test from bottom to top, I expect to receive another sell signal with an exit to 1.0860. The ultimate target will be a minimum of 1.0827, where I will take profit. In case of an upward movement of EUR/USD during the American session and the absence of bears at 1.0933, as this level has already played out and, as it seems major players did not find much desire to sell there, trading will remain within the ascending channel, opening the way for buyers to new monthly highs. In this case, I will postpone sales until the test of 1.0970. Selling can be considered, but only after an unsuccessful consolidation. I will consider opening short positions immediately on the rebound from 1.1004 with the goal of a downward correction of 30-35 points.

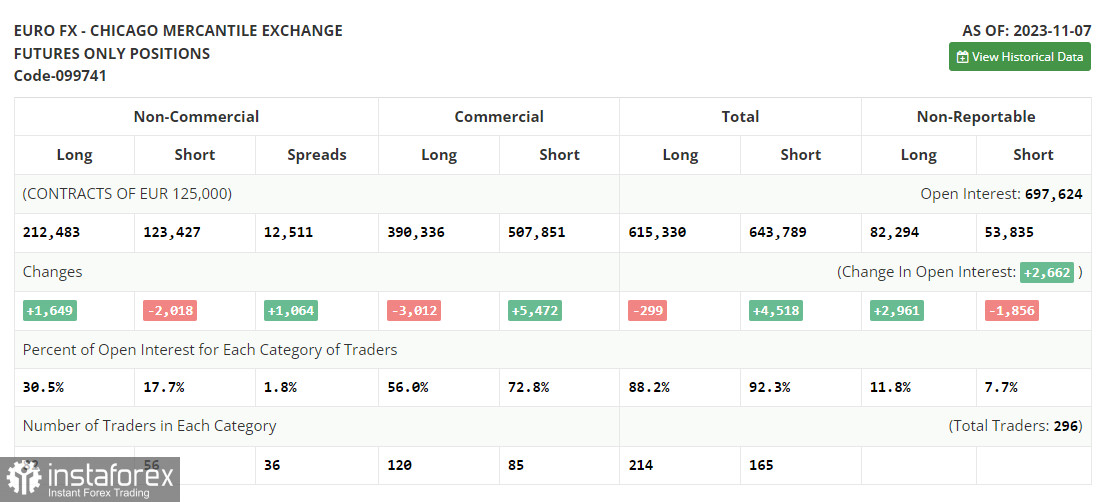
In the COT report (Commitment of Traders) for November 7, there was a reduction in short and an increase in long positions. It is worth noting that these data only include the market's reaction to the meeting of the US Federal Reserve, at which decisions were made to keep the policy unchanged. However, last week, representatives of the Fed made it clear that the further fate of interest rates will depend entirely on incoming data, not ruling out another increase at the end of this year. In the near future, we will familiarize ourselves with the US inflation report, which can set the direction for the pair for several weeks ahead, and several other important statistics. The COT report indicated that long non-commercial positions increased by 1,649 to 212,483, while short non-commercial positions decreased by 2,018 to 123,427. As a result, the spread between long and short positions increased by 1,064. The closing price sharply increased and amounted to 1.0713 against 1.0603.

Indicator Signals:
Moving Averages:
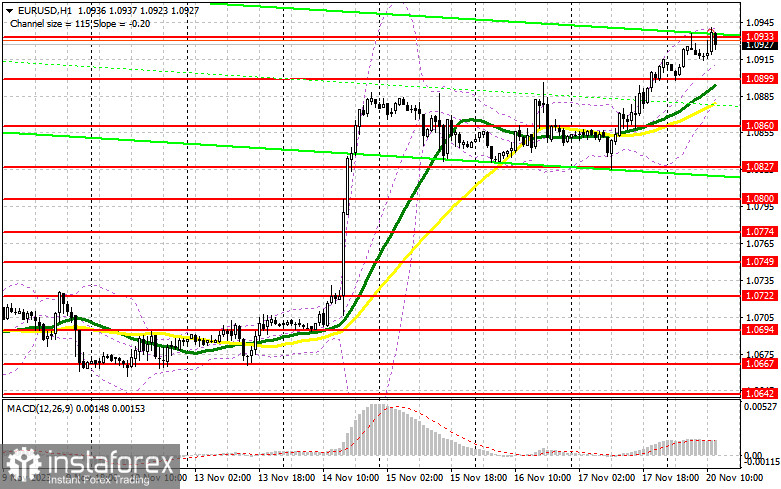
Trading is carried out above the 30 and 50-day moving averages, indicating further pair growth.
Note: The author considers the period and prices of moving averages on the hourly chart H1 and differs from the general definition of classic daily moving averages on the daily chart D1.
Bollinger Bands:
In case of a decline, the lower boundary of the indicator, around 1.0880, will act as support.
Description of Indicators:
- Moving Average (determines the current trend by smoothing volatility and noise). Period 50. Marked on the chart in yellow.
- Moving Average (determines the current trend by smoothing volatility and noise). Period 30. Marked on the chart in green.
- MACD Indicator (Moving Average Convergence/Divergence — convergence/divergence of moving averages). Fast EMA period 12. Slow EMA period 26. SMA period 9.
- Bollinger Bands. Period 20.
- Non-commercial traders are speculators, such as individual traders, hedge funds, and large institutions using the futures market for speculative purposes and meeting certain requirements.
- Long non-commercial positions represent the total long open position of non-commercial traders.
- Short non-commercial positions represent the total short open positions of non-commercial traders.
- The total non-commercial net position is the difference between non-commercial traders' short and long positions.