signal strength 3 of 5

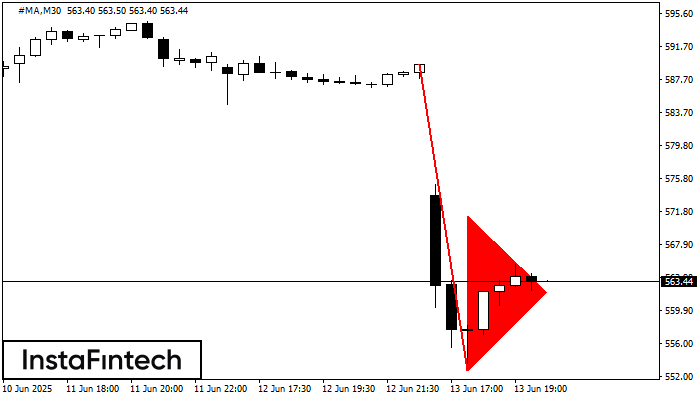
The Bearish pennant pattern has formed on the #MA M30 chart. This pattern type is characterized by a slight slowdown after which the price will move in the direction of the original trend. In case the price fixes below the pattern’s low of 552.75, a trader will be able to successfully enter the sell position.
- All
- Double Top
- Flag
- Head and Shoulders
- Pennant
- Rectangle
- Triangle
- Triple top
- All
- #AAPL
- #AMZN
- #Bitcoin
- #EBAY
- #FB
- #GOOG
- #INTC
- #KO
- #MA
- #MCD
- #MSFT
- #NTDOY
- #PEP
- #TSLA
- #TWTR
- AUDCAD
- AUDCHF
- AUDJPY
- AUDUSD
- EURCAD
- EURCHF
- EURGBP
- EURJPY
- EURNZD
- EURRUB
- EURUSD
- GBPAUD
- GBPCHF
- GBPJPY
- GBPUSD
- GOLD
- NZDCAD
- NZDCHF
- NZDJPY
- NZDUSD
- SILVER
- USDCAD
- USDCHF
- USDJPY
- USDRUB
- All
- M5
- M15
- M30
- H1
- D1
- All
- Buy
- Sale
- All
- 1
- 2
- 3
- 4
- 5
El patrón Banderín alcista está formado en el gráfico USDJPY M5. Este es un tipo de patrón de continuación. Supuestamente, en caso de que el precio se fije por encima
Los marcos de tiempo M5 y M15 pueden tener más puntos de entrada falsos.
Open chart in a new windowEl patrón Doble Techo ha sido formado en NZDUSD M5. Esto señala que la tendencia ha sido cambiada de alcista a bajista. Probablemente, si la base del patrón 0.6025
Los marcos de tiempo M5 y M15 pueden tener más puntos de entrada falsos.
Open chart in a new windowEl patrón Doble Piso ha sido formado en #KO M15. Características: el nivel de soporte 70.73; el nivel de resistencia 71.05; el ancho del patrón 32 puntos. Si el nivel
Los marcos de tiempo M5 y M15 pueden tener más puntos de entrada falsos.
Open chart in a new window