In my morning forecast, I emphasized the level of 1.2232 and recommended making entry decisions based on it. Let's look at the 5-minute chart and analyze what happened there. The breakout of this area did occur, but the retest from below did not happen. As a result, the pound's downward movement occurred without my participation. In the second half of the day, the technical picture changed slightly.
To open long positions on GBP/USD:
Another update of the monthly minimum has occurred, and whether the trend will continue or not, bears must continue to control the market. For this reason, without US data, it is better to buy the pound even at the current lows. Only one more false breakout formation at 1.2213 will allow for an entry point for long positions with a correction to 1.2248. Moving averages are on the bears' side, limiting the pair's upside potential. Breaking and holding above 1.2248 will restore confidence to buyers at the beginning of the week, signaling the opening of long positions with a target of 1.2287, where I expect larger sellers to appear. The ultimate target will be the area of 1.2327, where I will take profits. In the scenario of a decline to 1.2213 and the absence of buyer activity in the second half of the day, and most likely that will be the case, the pressure on the pound will only increase. In such a case, only the defense of 1.2168 and another false breakout will signal an entry into long positions. I plan to buy GBP/USD only on a bounce from 1.2115 with the aim of a 30-35 point correction within the day.
To open short positions on GBP/USD:
In the event of an increase in GBP/USD in the second half of the day, short positions around the new resistance at 1.2248, formed based on the first half of the day, will be the optimal scenario. In this case, the target will be the new local minimum of 1.2213. Breaking and retesting this range from bottom to top will deal a new serious blow to the bullish positions, opening up the possibility of a drop towards the support at 1.2168. The more distant target remains the area of 1.2115, where I will take profits. In the case of an upward movement in GBP/USD and the absence of a drop to 1.2248, buyers will have an excellent opportunity for a correction at the beginning of the week. I will postpone selling until a false breakout at 1.2282 in this scenario. Without a downward movement there, I will sell the pound on a bounce from 1.2327, but only with the expectation of a pair correction down by 30-35 points within the day.

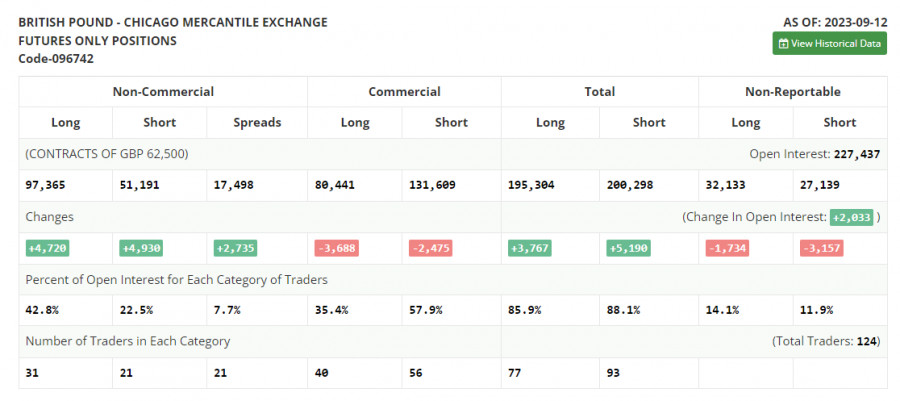
In the COT (Commitment of Traders) report as of September 12, there was an increase in both long and short positions. Released data on the growth of average earnings in the UK, which negatively affects inflation, and the contraction of the UK's GDP led to another sell-off of the British pound, which may intensify soon. In addition to the Bank of England meeting, where it is far from clear how they will handle interest rates, a report on the Consumer Price Index is scheduled. Almost all economists expect an increase in inflationary pressure in the UK in August of this year. I think you all understand what this could lead to in the face of a weakening economy – another significant sell-off of the pound against the US dollar. The latest COT report stated that long non-commercial positions increased by 4,720 to a level of 97,365, while short non-commercial positions also rose by 4,930 to 51,191. As a result, the spread between long and short positions increased by 2,735. The weekly price dropped and stood at 1.2486 against 1.2567.
Indicator Signals:
Moving Averages
Trading is taking place below the 30 and 50-day moving averages, indicating further decline in the pair.
Note: The author considers the period and prices of moving averages on the hourly chart (H1), and they differ from the standard definition of daily moving averages on the daily chart (D1).
Bollinger Bands
In case of a decrease, the lower boundary of the indicator, around 1.2213, will act as support.
Description of Indicators:
• Moving Average (determines the current trend by smoothing out volatility and noise). Period - 50. Marked in yellow on the chart;
• Moving Average (determines the current trend by smoothing out volatility and noise). Period - 30. Marked in green on the chart;
• MACD Indicator (Moving Average Convergence/Divergence - convergence/divergence of moving averages). Fast EMA - period 12. Slow EMA - period 26. SMA - period 9;
• Bollinger Bands. Period - 20;
• Non-commercial traders - speculators, such as individual traders, hedge funds, and large institutions using the futures market for speculative purposes and meeting certain requirements;
• Long non-commercial positions represent the total long open positions of non-commercial traders;
• Short non-commercial positions represent the total short open positions of non-commercial traders;
• The total non-commercial net position is the difference between non-commercial traders' short and long positions.


