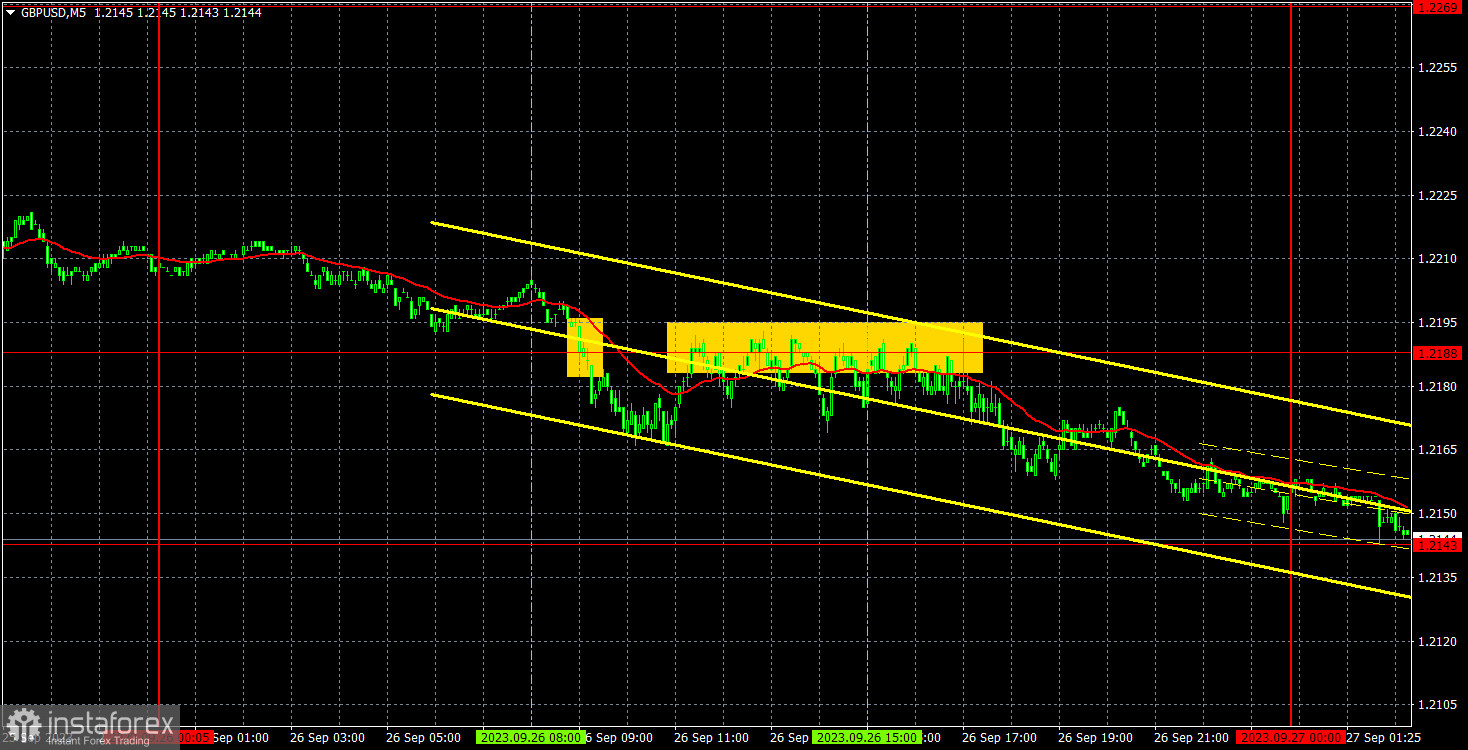
Analysis of GBP/USD 5M
GBP/USD continued to see negative trading on Tuesday. In general, it doesn't even make sense to distinguish the movement by days because every day we continue to see the same thing – the pair is gradually but steadily decreasing. The daily losses are not significant – 20 pips, 30 pips, but they occur practically every day with little to no retracements or corrections to the upside. Some might find this strange, especially considering the complete absence of economic reports and fundamental events. However, we have repeatedly stated that the pound should fall and will fall because its growth since the beginning of 2023 was entirely illogical. Therefore, this is simply a means to restore balance in the market.
Only two trading signals were formed on Tuesday, and they generally duplicated each other. First, GBPUSD settled below the level of 1.2188, and then the pair rebounded from this level from below, although this rebound took more than five hours. Nevertheless, both signals were clear, and they indicated a short position. Since volatility was quite low, the pair managed to move in the right direction by just 15 pips, which could be earned on Tuesday. However, it is very difficult to expect significant profits from intraday trading, despite the strong and steady downtrend of the pound.
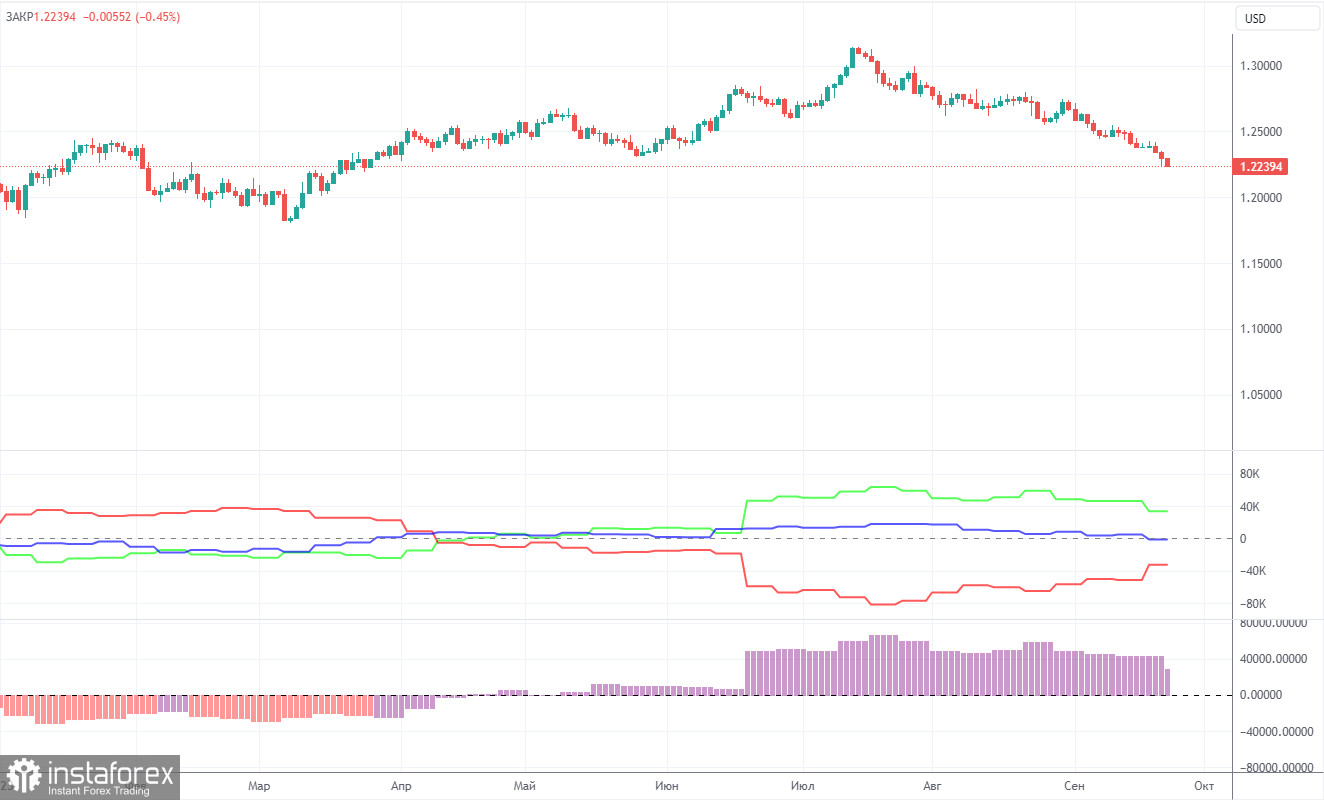
COT report:
According to the latest COT report on GBP/USD, the Non-commercial group closed 12,300 long positions and opened 200 short positions. Thus, the net position of non-commercial traders decreased by 12,500 contracts over the week. The net position indicator has been steadily increasing over the past 12 months, but the pound sterling has started to fall in the last two months, which we have been waiting for for so many months now. Perhaps we are at the very beginning of a protracted downtrend. At least in the coming months, we do not see any bullish prospects for the pound.
The British currency has jumped by a total of 2,800 pips from its absolute lows reached last year. All in all, it has been a stunning rally without a strong downward correction. Thus, further growth would be utterly illogical. We're not against the upward trend. We simply believe that GBP/USD needs a good downward correction first and then assess the factors supporting the dollar and the pound. A correction to the level of 1.1844 would be enough to establish a fair balance between the two currencies. The Non-commercial group currently holds a total of 85,000 longs and 51,400 shorts. The bears have started to take the initiative in recent weeks, and we believe that this trend will continue in the near future.
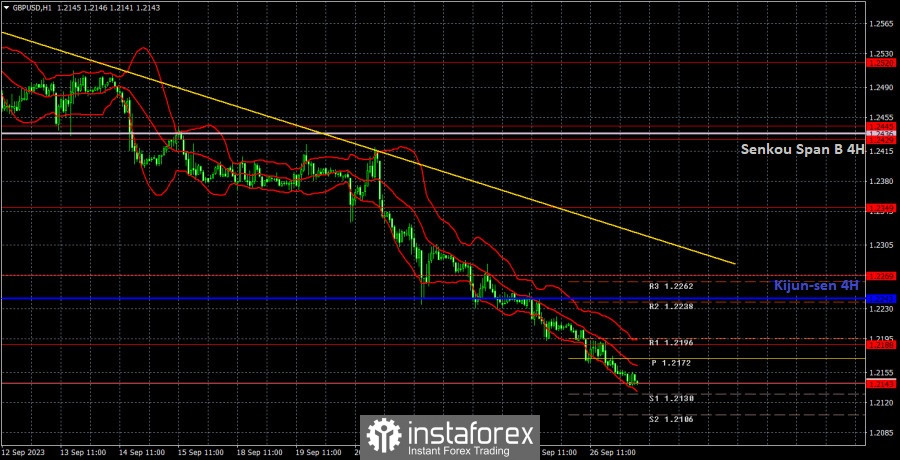
Analysis of GBP/USD 1H
On the 1H chart, GBP/USD continues to trade lower, losing ground almost every day. The pound sterling is still poised to decline and can't correct upwards. We have repeatedly mentioned that the only logical step for the pound is to fall. Congratulations! Over the past two months, the pound has depreciated by almost 1000 pips, which we already expected. The trend line remains relevant, and the price is below all the Ichimoku indicator lines, so there is no reason for the downtrend to end anytime soon.
On September 27, traders should pay attention to the following key levels: 1.1760, 1.1874, 1.1927-1.1965, 1.2143, 1.2188, 1.2269, 1.2349, 1.2429-1.2445, 1.2520, 1.2605-1.2620, 1.2693. The Senkou Span B (1.2436) and Kijun-sen (1.2243) lines can also be sources of signals, e.g. rebounds and breakout of these levels and lines. It is recommended to set the Stop Loss orders at the breakeven level when the price moves in the right direction by 20 pips. The lines of the Ichimoku indicator can move during the day, which should be taken into account when determining trading signals. There are support and resistance levels that can be used to lock in profits.
On Wednesday, the UK event calendar is basically empty, while the US will release a report on durable goods orders. This report has the potential to provoke a market reaction, so be cautious in the second half of the day, as the pair could correct higher.
Description of the chart:
Support and resistance levels are thick red lines near which the trend may end. They do not provide trading signals;
The Kijun-sen and Senkou Span B lines are the lines of the Ichimoku indicator, plotted to the 1H timeframe from the 4H one. They provide trading signals;
Extreme levels are thin red lines from which the price bounced earlier. They provide trading signals;
Yellow lines are trend lines, trend channels, and any other technical patterns;
Indicator 1 on the COT charts is the net position size for each category of traders;
Indicator 2 on the COT charts is the net position size for the Non-commercial group.