empty
21.11.2023 04:41 AM
Trading plan for EUR/USD on November 21. Simple tips for beginners

Analyzing Monday's trades:

EUR/USD on 30M chart

This image is no longer relevant

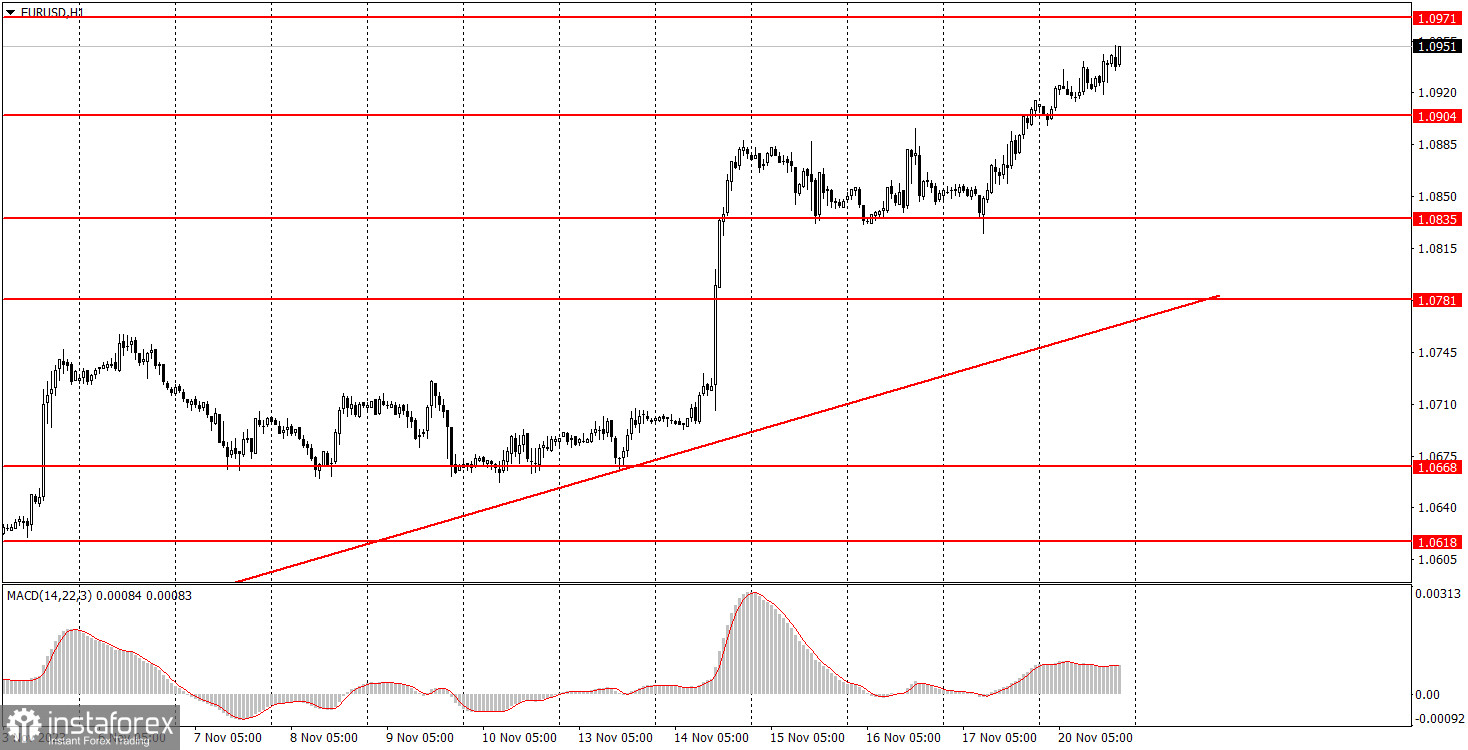
EUR/USD was able to easily extend its upward movement on Monday. We had doubts about the rally on Friday, as not only were there no grounds for it, but there were also no economic reports in sight to support it. But then there were no reports on Monday either. Traders hardly paid attention to the producer price index in Germany, in fact, this is not even a secondary, but a tertiary report. Obviously, it did not trigger the euro's growth.

And so the euro continues to rise, and for five or six days now, it has raised very big questions. This movement resembles a sort of momentum, where the market buys the pair only because it is rising. At least, we do not see any fundamental and macroeconomic reasons for the euro to rise.

EUR/USD on 5M chart

This image is no longer relevant

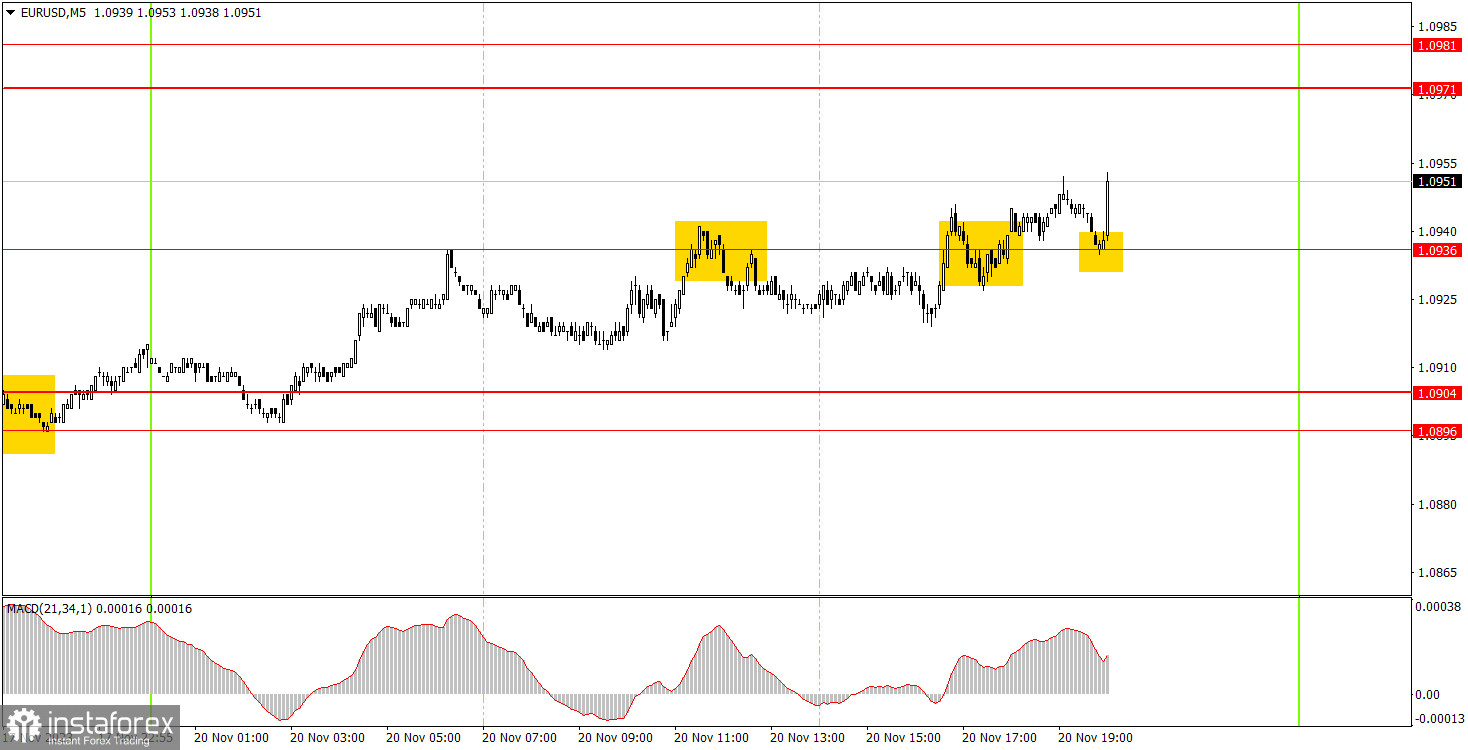
On the 5-minute chart, three trading signals were generated, but the total volatility was just 54 pips. As it found its first level on the way, the pair managed to test it several times and overcame it. There wasn't much to look forward to even in the face of what seemed like a trend movement. Each of the signals led to a movement of a maximum of 10 pips. Unfortunately, it was another "boring Monday."

Trading tips on Tuesday:

On the 30-minute chart, the corrective phase remains intact. It started another round of this phase due to the U.S. inflation data. Despite the substantial growth, a correction is still a correction. Therefore, we expect it to come to an end and the downtrend to resume. Currently, we have an ascending trend line, so we can determine the end of the corrective trend. The key levels on the 5M chart are 1.0568, 1.0611-1.0618, 1.0668, 1.0733, 1.0767-1.0781, 1.0835, 1.0896-1.0904, 1.0936, 1.0971-1.0981, 1.1011, 1.1043, 1.1091. A stop loss can be set at a breakeven point as soon as the price moves 15 pips in the right direction. On Tuesday, there is no significant event planned in the European Union and the United States. We can only highlight the minutes of the Federal Reserve's last meeting, which is just a formality and will be published late in the evening and by then, beginners have probably left the market.

Basic trading rules:

1) Signal strength is determined by the time taken for its formation (either a bounce or level breach). A shorter formation time indicates a stronger signal.

2) If two or more trades around a certain level are initiated based on false signals, subsequent signals from that level should be disregarded.

3) In a flat market, any currency pair can produce multiple false signals or none at all. In any case, the flat trend is not the best condition for trading.

4) Trading activities are confined between the onset of the European session and mid-way through the U.S. session, post which all open trades should be manually closed.

5) On the 30-minute timeframe, trades based on MACD signals are only advisable amidst substantial volatility and an established trend, confirmed either by a trend line or trend channel.

6) If two levels lie closely together (ranging from 5 to 15 pips apart), they should be considered as a support or resistance zone.

How to read charts:

Support and Resistance price levels can serve as targets when buying or selling. You can place Take Profit levels near them.

Red lines represent channels or trend lines, depicting the current market trend and indicating the preferable trading direction.

The MACD(14,22,3) indicator, encompassing both the histogram and signal line, acts as an auxiliary tool and can also be used as a signal source.

Significant speeches and reports (always noted in the news calendar) can profoundly influence the price dynamics. Hence, trading during their release calls for heightened caution. It may be reasonable to exit the market to prevent abrupt price reversals against the prevailing trend.

Beginning traders should always remember that not every trade will yield profit. Establishing a clear strategy coupled with sound money management is the cornerstone of sustained trading success.

Paolo Greco,
الخبير التحليلي لدى شركة إنستافوركس
© 2007-2025
حدد الإطار الزمني
5
د
15
د
30
د
1
س
4
ساعات
1
يوم
1
أسبوع
كسب عائد من تغيرات أسعار العملات المشفرة مع إنستافوركس.
قم بتحميل منصة التداول ميتاتريدر 4 وافتح أول صفقة.
  • Grand Choice
    Contest by
    InstaForex
    InstaForex always strives to help you
    fulfill your biggest dreams.
    انضم إلى المسابقة

المقالات الموصى بها

كيفية تداول زوج الجنيه الإسترليني/الدولار الأمريكي في 16 يونيو؟ نصائح بسيطة وتحليل التداول للمبتدئين

في يوم الجمعة، أظهرت حركة زوج الجنيه الإسترليني/الدولار الأمريكي تحركات تكاد تكون متطابقة مع زوج اليورو/الدولار الأمريكي. وذلك لأن العوامل الرئيسية كانت نفسها. الهجوم الليلي لإسرائيل على إيران

Paolo Greco 07:07 2025-06-16 UTC+2

كيفية تداول زوج اليورو/الدولار الأمريكي في 16 يونيو؟ نصائح بسيطة وتحليل التداول للمبتدئين

في ليلة الجمعة، شهد زوج العملات اليورو/الدولار الأمريكي انخفاضًا حادًا، تلاه تعافٍ خلال بقية اليوم. وبالتالي، يمكن تقسيم اليوم بأكمله إلى جزئين. في البداية، تعزز الدولار بثقة (وهو أمر أصبح

Paolo Greco 07:07 2025-06-16 UTC+2

توصيات وتحليل التداول لزوج الجنيه الإسترليني/الدولار الأمريكي في 16 يونيو: الجنيه لا يشعر بأي مقاومة من الدولار

يوم الجمعة، واصل زوج العملات GBP/USD حركته الصعودية. لفهم ما يحدث مع الجنيه الإسترليني بشكل أفضل، من الأفضل الانتقال إلى الإطار الزمني اليومي. هناك، نلاحظ ارتفاعًا قويًا بدأ تحديدًا

Paolo Greco 04:53 2025-06-16 UTC+2

توصيات وتحليل التداول لزوج اليورو/الدولار الأمريكي في 16 يونيو: هل سيكون هناك عاصفة جديدة يوم الاثنين؟

خلال جلسة يوم الاثنين، تحرك زوج العملات EUR/USD في كلا الاتجاهين. أولاً، كان هناك انخفاض حاد في الأسعار (لمن لم يكن نائمًا) بسبب هجوم إسرائيل على إيران

Paolo Greco 04:53 2025-06-16 UTC+2

GBP/USD: خطة التداول للجلسة الأمريكية في 13 يونيو (مراجعة تداولات الصباح)

في توقعاتي الصباحية، قمت بتسليط الضوء على مستوى 1.3531 وخططت لاتخاذ قرارات التداول بناءً عليه. دعونا نلقي نظرة على الرسم البياني لمدة 5 دقائق ونحلل ما حدث. أدى الانخفاض يليه

Miroslaw Bawulski 12:37 2025-06-13 UTC+2

EUR/USD: خطة التداول للجلسة الأمريكية في 13 يونيو (مراجعة التداولات الصباحية)

في توقعاتي الصباحية، قمت بتسليط الضوء على مستوى 1.1556 وخططت لاتخاذ قرارات دخول السوق بناءً عليه. دعونا نلقي نظرة على الرسم البياني لمدة 5 دقائق ونحلل ما حدث. أدى الارتفاع

Miroslaw Bawulski 12:31 2025-06-13 UTC+2

كيفية تداول زوج الجنيه الإسترليني/الدولار الأمريكي في 13 يونيو؟ نصائح بسيطة وتحليل التداول للمبتدئين

يوم الخميس، أظهر زوج الجنيه الإسترليني/الدولار الأمريكي حركة صعودية قوية نسبيًا، رغم أن الجنيه الإسترليني شهد تراجعات خلال اليوم. كانت هناك العديد من التطورات الإخبارية. على سبيل المثال، خلال الجلسة

Paolo Greco 06:31 2025-06-13 UTC+2

كيفية تداول زوج اليورو/الدولار الأمريكي في 13 يونيو؟ نصائح بسيطة وتحليل التداول للمبتدئين

شهد زوج العملات اليورو/الدولار الأمريكي يوم الخميس وخلال الليل حتى يوم الجمعة "سباقًا على الطريقة الأمريكية". خلال اليومين الماضيين، تراجع الدولار الأمريكي مرة أخرى مع استمرار الاحتجاجات والاضطرابات الجماهيرية

Paolo Greco 06:31 2025-06-13 UTC+2

توصيات وتحليل التداول لزوج الجنيه الإسترليني/الدولار الأمريكي في 13 يونيو: الناتج المحلي الإجمالي الضعيف أفسد الصورة للجنيه.

يوم الخميس، واصل زوج العملات GBP/USD التحرك صعودًا. ومع ذلك، وبشكل مفاجئ إلى حد ما، ارتفع الجنيه الإسترليني هذا الأسبوع أقل من اليورو. تعرضت العملة البريطانية للضغط أولاً من تقارير

Paolo Greco 03:41 2025-06-13 UTC+2

توصيات وتحليل التداول لزوج اليورو/الدولار الأمريكي في 13 يونيو: ترامب يحذر من زيادة الرسوم الجمركية

واصل زوج العملات EUR/USD حركته الصعودية القوية يوم الخميس، والتي بدأت يوم الأربعاء. وبدأت حركة تصحيحية هابطة في نهاية اليوم، لكنها كانت أضعف بكثير من الارتفاع السابق. بدأت الموجة التالية

Paolo Greco 03:40 2025-06-13 UTC+2
لا تستطيع التحدث الآن؟
اطرح سؤالك في الدردشة.
Widget callback
 

Dear visitor,

Your IP address shows that you are currently located in the USA. If you are a resident of the United States, you are prohibited from using the services of InstaFintech Group including online trading, online transfers, deposit/withdrawal of funds, etc.

If you think you are seeing this message by mistake and your location is not the US, kindly proceed to the website. Otherwise, you must leave the website in order to comply with government restrictions.

Why does your IP address show your location as the USA?

  • - you are using a VPN provided by a hosting company based in the United States;
  • - your IP does not have proper WHOIS records;
  • - an error occurred in the WHOIS geolocation database.

Please confirm whether you are a US resident or not by clicking the relevant button below. If you choose the wrong option, being a US resident, you will not be able to open an account with InstaForex anyway.

We are sorry for any inconvenience caused by this message.