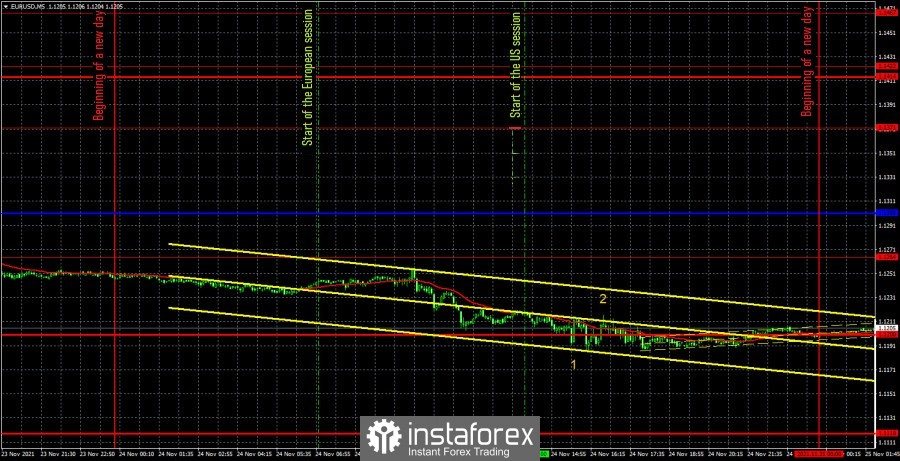
EUR/USD 5M

The EUR/USD pair kept its downward trend on Wednesday, although this is no longer surprising. But the trading itself on Wednesday was very, very remarkable. Let us remind you that a fairly large number of macroeconomic publications were planned in the United States yesterday. Naturally, everything - in the afternoon. So the markets resumed short positions on the European currency in the first half of the day, when there were no important events and news. On the other hand, in the US trading session, there was a very weak movement with a minimal downward bias. It should also be noted that all macroeconomic data, which were released in two blocks, in fact, had no effect on the pair's movement. But among all the published reports there was data on GDP for the third quarter, data on orders for durable goods, data on changes in personal income and expenses of the US population, data on applications for unemployment benefits. Maybe, if taken separately, then not the most important reports, but all together, they still should have caused at least some kind of reaction. However, in the chart above you can clearly see (numbers "1" and "2") that no reaction followed. All that remains is to analyze the trading signals and understand how one should trade on Wednesday. And there is a little problem here. Despite the fact that the volatility was quite high yesterday, as for the EUR/USD pair, not a single trading signal was generated either in the Asian trading session or during the daytime. Thus, there is simply nothing to analyze.
EUR/USD 1H
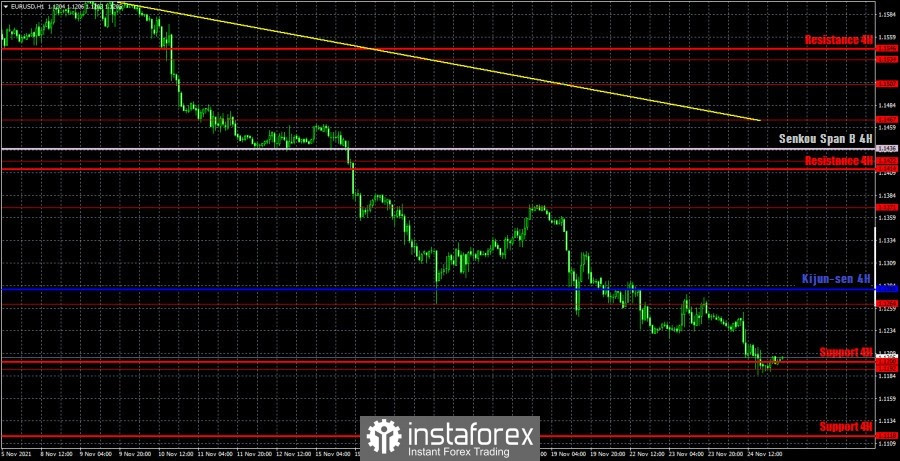
On the hourly timeframe, the downward movement continues and it can clearly be seen. The price does not even try to approach the downtrend line, we are now witnessing such a strong movement. Markets do not even wait for the next reports or important events to open new short positions. The pair just falls steadily every day. Such a movement is much better than the everyday flat that we observed for several months before, but at the moment the price is at such price values that it has not been at for a year, at least, and there are few levels here. Therefore, there are also few signals. We highlight the following levels for trading on Thursday - 1.1192, 1.1264, 1.1371, as well as the Senkou Span B (1.1436) and Kijun-sen (1.1280) lines. The Ichimoku indicator lines can change their position during the day, which should be taken into account when looking for trading signals. Signals can be rebounds or breakthroughs of these levels and lines. Do not forget about placing a Stop Loss order at breakeven if the price moves 15 points in the right direction. This will protect you against possible losses if the signal turns out to be false. European Central Bank President Christine Lagarde will speak in the European Union, and absolutely nothing in the United States on November 25. The exact opposite of yesterday, when there were plenty of macroeconomic reports. Nevertheless, the markets show every day that they do not need a fundamental background right now to continue selling the euro and buying the dollar. Lagarde's speech is unlikely to cause a reaction from the market, and even more so it is unlikely to support the euro.
We recommend you to familiarize yourself:
Overview of the EUR/USD pair. November 25. "Coronavirus" swept over Germany. The locomotive of the European economy may stop...
Overview of the GBP/USD pair. November 25. A year has passed. The UK and EU are still in talks. The rhetoric of Maros Sefcovic does not change.
Forecast and trading signals for GBP/USD for November 25. Detailed analysis of the movement of the pair and trade deals.
Analysis of the COT report
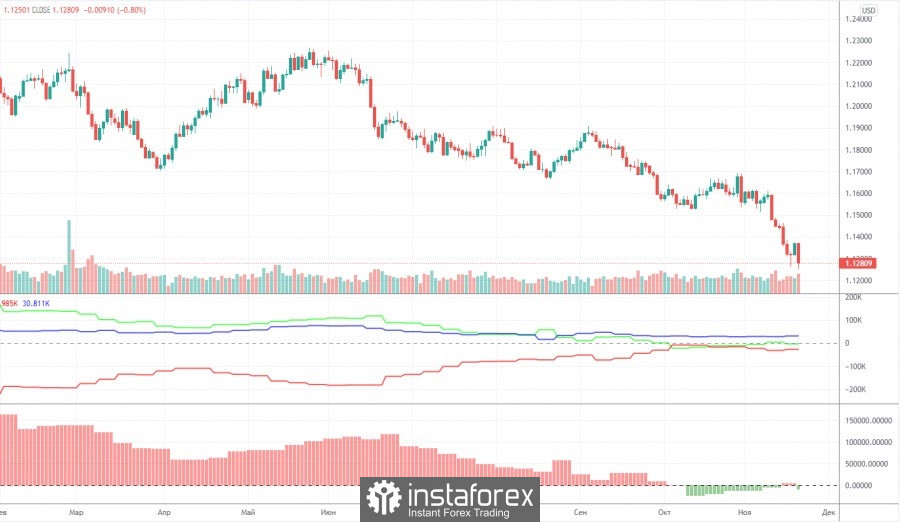
The mood of non-commercial traders changed quite significantly during the last reporting week (November 9-15). A group of non-commercial traders opened 7,000 buy contracts (longs) and 20,500 sell contracts (shorts) during the week. Thus, the net position for professional traders decreased by 13,500, and the mood became more "bearish". It should be noted that the European currency has dropped quite seriously over the past few weeks. But the net position for the "non-commercial" group, starting from October, practically does not change. This is signaled by the green line of the first indicator in the chart above. Almost all this time, it has been near the zero level, indicating the absence of serious changes in the mood of major players. Thus, if the general trend remains the same - over the past ten months, large players have seriously reduced the number of longs and increased the number of shorts, then in the past few weeks nothing of the kind has been observed, and the European currency was still falling. This suggests that what is happening on the market now does not quite correspond to the actions of large players. The second indicator (the net position for professional traders in the form of a histogram) shows that in the last six weeks the mood of traders has become less bearish, that is, in theory, at this time the euro should have been growing, not falling. Thus, if we draw a conclusion only on the basis of the Commitment of Traders (COT) reports, then a further fall in the euro currency is completely unclear.
Explanations for the chart:
Support and Resistance Levels are the levels that serve as targets when buying or selling the pair. You can place Take Profit near these levels.
Kijun-sen and Senkou Span B lines are lines of the Ichimoku indicator transferred to the hourly timeframe from the 4-hour one.
Support and resistance areas are areas from which the price has repeatedly rebounded off.
Yellow lines are trend lines, trend channels and any other technical patterns.
Indicator 1 on the COT charts is the size of the net position of each category of traders.
Indicator 2 on the COT charts is the size of the net position for the non-commercial group.