Long-term outlook.
The EUR/USD currency pair has attempted to maintain its recent upward trend once more this week, although, during the past two weeks, it has begun to noticeably drop. About 250 points were lost in two days, which is an excellent foundation for the development of the substantial correction we have been anticipating for more than a month. Recall that the euro has been steadily increasing over the past few weeks, which has confused both us and some other analysts and experts a great deal. The underlying and macroeconomic conditions in January (and December as well) just did not support significant growth. But the pair nevertheless managed to gain 1200 points in a matter of months, which is half of the whole downward trend that lasted for two years. For the longest time, we have been claiming that the euro has grown too quickly and abruptly, making it overbought. Over the past three months, there has only been one correction totaling 250 points. As a result, practically everything supported the pair's demise.
We also pointed out that market expectations for the rate of monetary policy tightening in the United States to slow down were a major contributor to the growth of the euro currency. This component, however, was not able to influence traders' attitudes indefinitely. The euro dropped this week after the ECB decided to hike its key rate by 0.5%, which is essentially a "hawkish" move. When significant information on the US labor market and unemployment was released on Friday, the European currency continued to decline. The market "upfront" anticipated the ECB tightening its monetary policy, which is why we witnessed a decline on Thursday. I suppose nobody was prepared for the powerful American numbers. We think that the difference between the Fed and ECB interest rates has been resolved. This does not exclude the euro currency from advancing northward in the future, as the price currently incorporates an increase in the interest rate of 0.75% at the following meetings. If the ECB rate rises further after that, this will serve as a new justification for the euro's growth. But the correction was still coming, and it should now develop.
COT evaluation.
The recent COT reports on the euro currency are entirely consistent with market activity. The aforementioned image makes it very evident that from the start of September, the net position of significant players (the second indicator) has been improving. At about the same time, the value of the euro started to increase. Although the net position of non-commercial traders is currently "bullish" and growing virtually weekly, it is the relatively high value of the "net position" that now signals the upward trend's impending end. The first indicator, which frequently occurs before the trend's end and shows that the red and green lines are very far apart from one another, signals this. The number of buy contracts from the "non-commercial" group climbed by 9.5 thousand during the most recent reporting week, while the number of short positions decreased by 2,000. The net position consequently climbed by 7.5 thousand contracts. For non-commercial traders, there are currently 134 thousand more buy contracts than sell contracts. The question of how much more the major players will increase their stakes now arises. Moreover, a downward correction should have started long ago from a technical perspective. We think this process can't go on for another two or three months. You need to "discharge" a bit, or alter, even based on the net position indicator. Sales are 52 thousand more if you look at the overall indications of open longs and shorts for all trading categories.
Analysis of important events.
All of this week's important data arrived in the second half of the week. We've already discussed the Fed and ECB meetings, but it's important to remember that Jerome Powell and Christine Lagarde's statements were "moderately hawkish," and raising interest rates is always a "hawkish" move. Additionally, the United States had 517 thousand non-farms as of Friday, compared to a prediction of 185–190 thousand. Despite a consistent decline over the past year, as we have stated in recent months, the Nonfarm Index is rather solid. Since 200 thousand is a great number per month, there shouldn't have been any adverse effects on this indicator. Therefore, the US dollar continued to grow in strength as non-farm payrolls managed to exceed the forecast by 2.5 times and unemployment managed to drop even further. The oversold dollar, we believe, received significant support from the macroeconomic backdrop. It can now continue to strengthen for a few weeks.
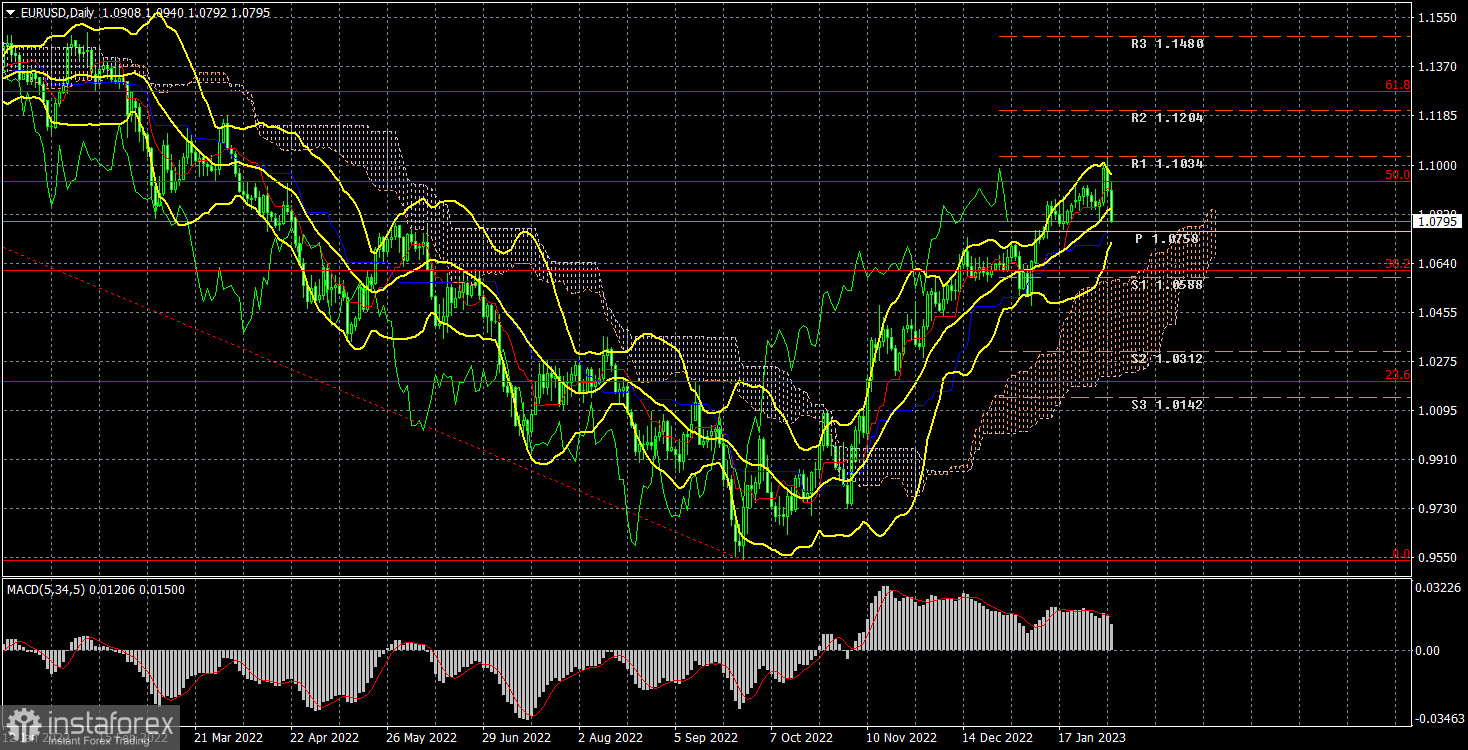
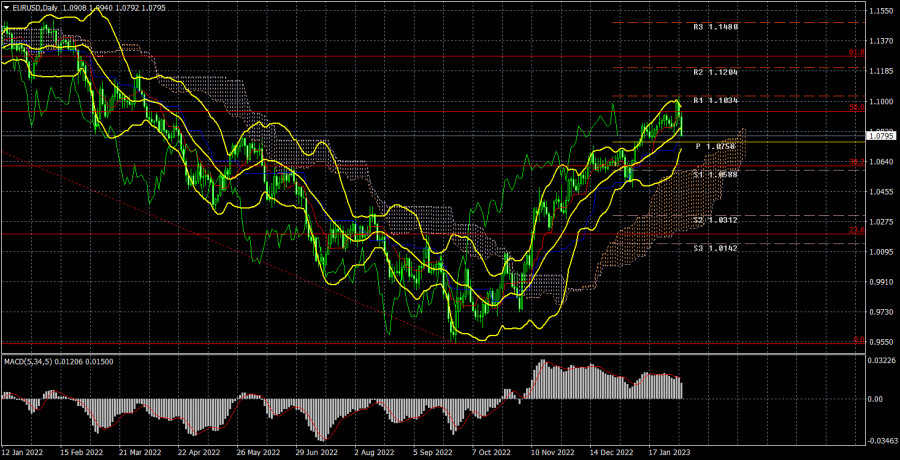
1) In the 24-hour period, the pair is located above all of the Ichimoku indicator's lines, giving it a strong likelihood of continuing to rise. This is the trading strategy for the week of February 6–10. The pair is currently approaching the critical line. Growth may restart with targets of 1.1171 and 1.1270 if it is unable to do so. However, we anticipate a correction and consolidation below this line.
2) The sales of the euro/dollar pair are no longer significant. You should now wait for the price to return below the important Ichimoku indicator lines before considering short positions. There are currently no sales indications on the 24-hour TF, but if the key line is crossed, the pair will already be able to anticipate falling to the area between 1.0300 and 1.0500, which is where the Senkou Span B line runs. They are, however, on the 4-hour TF.
Explanations of the illustrations:
Price levels of support and resistance (resistance and support), Fibonacci levels – targets when opening purchases or sales. Take Profit levels can be placed near them.
Ichimoku indicators (standard settings), Bollinger bands (standard settings), MACD (5, 34, 5).
Indicator 1 on the COT charts is the net position size of each category of traders.
Indicator 2 on the COT charts is the net position size for the "non-commercial" group.