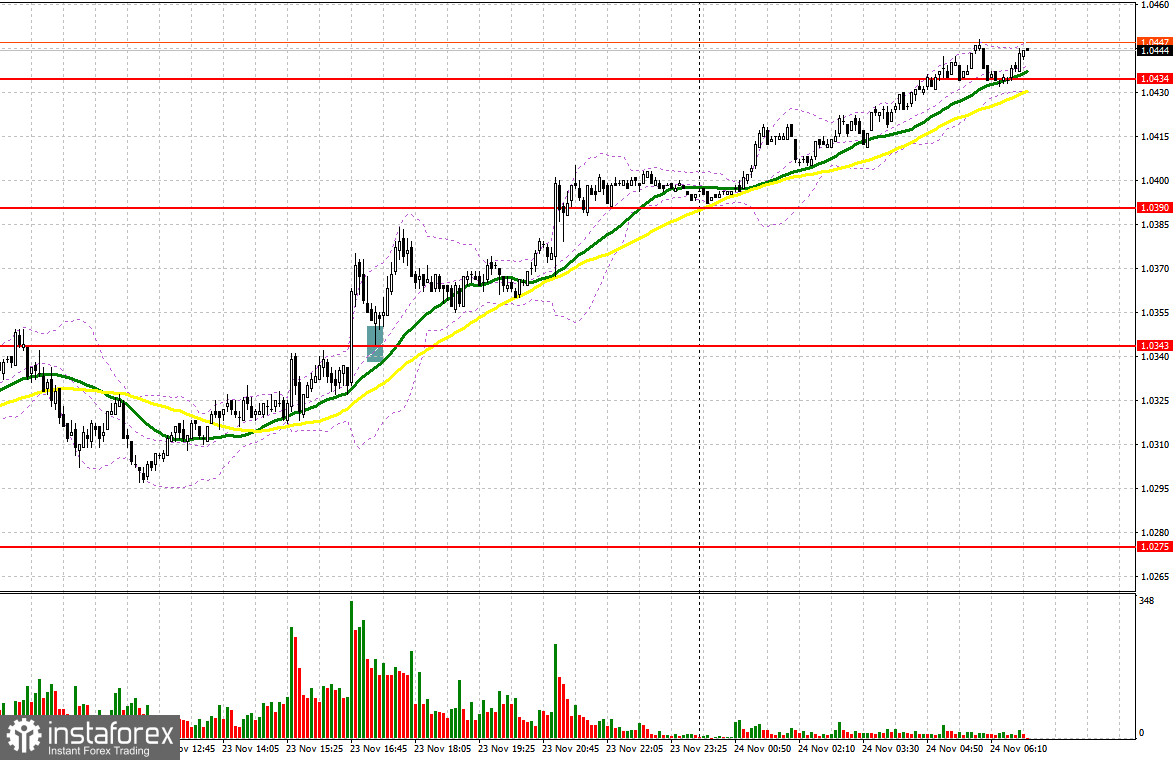
Yesterday, a few significant entry signals were made. Let's take a look at the M5 chart to get a picture of what happened. In the previous review, we focused on the mark of 1.0333 where we considered entering the market. A breakout and a test to the downside of the 1.0333 level following the release of business activity data in the eurozone generated a buy signal. However, after an 11-pip rise, the price got back to 1.0333. Although the PMI results came better than expected, they still illustrate contraction. In this light, it was wiser to exit the market. During the North American session, following the disappointing macro statistics in the US, the bulls broke and retested the mark of 1.0343, which made a buy signal. The price then rose to 1.0390, bringing a profit of some 50 pips.
When to go long on EUR/USD:
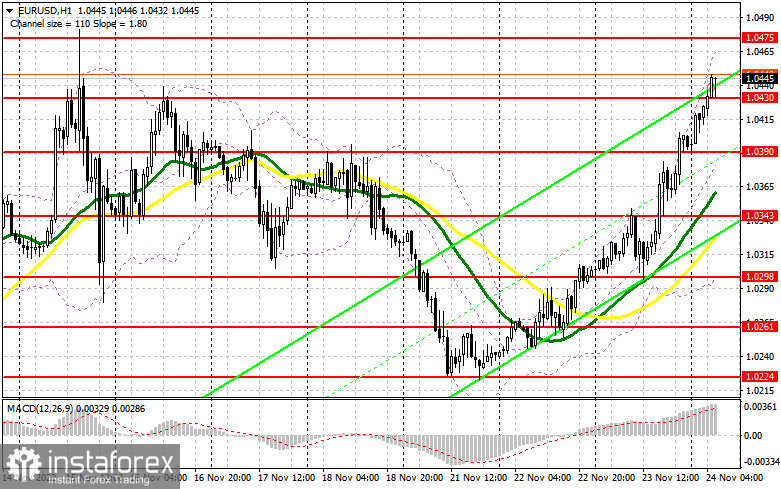
After the release of the pessimistic business activity and jobless claims reports, it became clear that the US economy is sliding into a recession. In addition, the FOMC Minutes for November also hinted at that. Most policymakers say there is now a 50% chance of a recession next year. Still, they continue to advocate for further rate hikes. Germany's macro data due today may push the euro down today if it comes worse than expected. The release of the ECB monetary policy meeting accounts will go unnoticed by traders as always. Meanwhile, the speeches of some of the bank's officials will be of great interest as they are likely to confirm the need for further rate increases in the eurozone. Therefore, the euro may strengthen against the dollar today. If Germany's macro statistics come disappointing, the pair will go down. Then, it will become possible to go long at the nearest support of 1.0430. A false breakout there will confirm the presence of major players in the market who bet on further growth, and the pair will return to the monthly high of 1.0475. Still, the pair may find it hard to break above the barrier. In the event of a breakout and a test of this range to the downside, EUR/USD may head towards 1.0525. Above this range, there is the level of 1.0568. A breakout of this mark will trigger a row bearish stop orders and generate an additional buy signal with the target at 1.0604, where the profit-taking stage may begin. In such a case, the uptrend will get stronger. If EUR/USD goes down when there is no bullish activity at 1.0430, the pressure on the euro will increase. A breakout through 1.0430 will lead to the pair's fall to 1.0390 support where long positions could be considered after a false breakout only. Also, it will be possible to buy EUR/USD immediately on a rebound at 1.0343, which is in line with the bullish moving averages, or even lower, in the area of 1.0298, allowing a bullish correction of 30-35 pips intraday.
When to go short on EUR/USD:
Clearly, the bears retreated amid the pessimistic macro results, which once again prove that it is now the wrong time for reducing the pace of rate hikes in the US. The bears should protect the monthly high of 1.0475, which is about to be tested. A false breakout through 1.0475 will create an excellent entry point and push the euro back toward 1.0430 support formed today. Consolidation below this range will occur in case of weak macro data for Germany, which will indicate a slowdown in economic growth. A retest of the 1.0430 level to the upside will make a sell signal and trigger a row of bullish stop orders, and the pair will fall to 1.0390 where bullish activity is expected to increase. The most distant target is seen in the area of 1.0343, where a profit-taking stage may begin. If EUR/USD goes up during the European session when there is no bearish activity at 1.0475, demand for the pair will only increase. In such a case, we may expect a continuation of the bull market and a test of the 1.0525 mark. However, it is important to remember that today is Thanksgiving Day in the US. This means that trading volumes in the afternoon will be quite low and there will be no point in buying the euro above monthly highs. In this case, it would be wiser to go short at 1.0525 after a false breakout only. It will be possible to sell EUR/USD immediately after a bounce off the 1.0568 high, or even higher, at 1.0604, allowing a bearish correction of 30-35 pips.
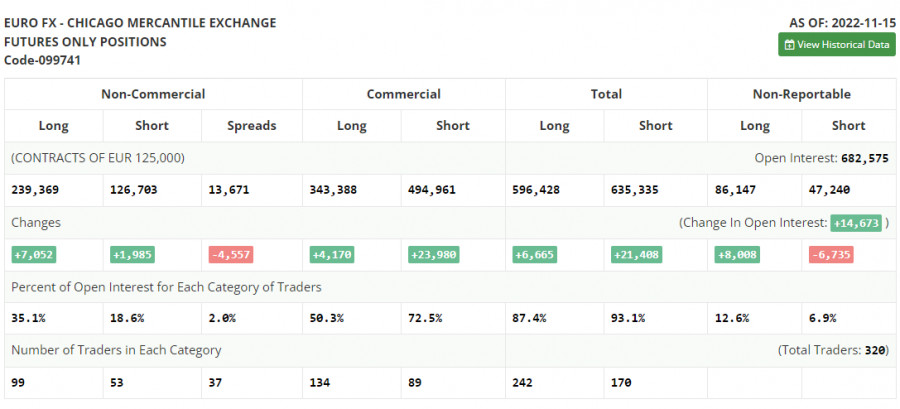
Commitments of Traders:
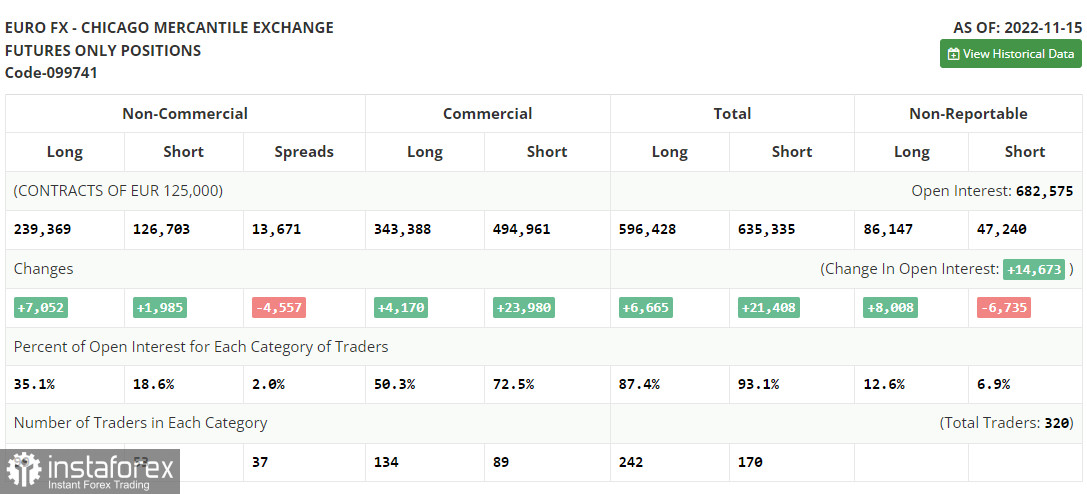
The COT report from November 15 logged an increase in both short and long positions. There has been growing speculation lately on the Fed's less-aggressive stance on monetary tightening which could be announced in December. However, such assumptions contradict the latest US retail sales data for October, which came better than expected, proving high inflationary pressure at the end of the year. For this reason, the recent US inflation report should be treated with caution as the CPI indicated easing inflationary pressure. Apparently, the Federal Reserve will stick to its hawkish agenda, going ahead with sharp rate hikes. When it comes to the euro, demand for risky assets has grown a bit. Nevertheless, following the latest EU statistics, especially GDP, the pair is unlikely to show another explosive jump by the year-end. According to the COT report, long non-commercial positions rose by 7,052 to 239,369 and short non-commercial positions increased by 1,985 to 126,703. The total non-commercial net positions remained at 112,666 last week versus 107,599 a week ago. In other words, investors keep taking advantage of the situation and buying the undervalued euro even above the parity level. Traders are accumulating long positions, hoping for a resolution to the crisis and betting on a stronger euro in the long term. The weekly closing price rose to 1.0390 versus 1.0104.
Indicator signals:
Moving averages
Trading is carried out above the 30-day and 50-day moving averages, a continuing recovery in the euro.
Note: The period and prices of moving averages are viewed by the author on the hourly chart and differ from the general definition of classic daily moving averages on the daily chart.
Bollinger Bands
The lower band at 1.0298 stands as support. Resistance is seen at 1.0475 in line with the upper band.
Indicator description:
- Moving average (MA) determines the current trend by smoothing volatility and noise. Period 50. Colored yellow on the chart.
- Moving average (MA) determines the current trend by smoothing volatility and noise. Period 30. Colored green on the chart.
- Moving Average Convergence/Divergence (MACD). Fast EMA 12. Slow EMA 26. SMA 9.
- Bollinger Bands. Period 20
- Non-commercial traders are speculators such as individual traders, hedge funds, and large institutions who use the futures market for speculative purposes and meet certain requirements.
- Long non-commercial positions are the total long position of non-commercial traders.
- Non-commercial short positions are the total short position of non-commercial traders.
- Total non-commercial net position is the difference between the short and long positions of non-commercial traders.