empty
16.08.2019 08:12 AM
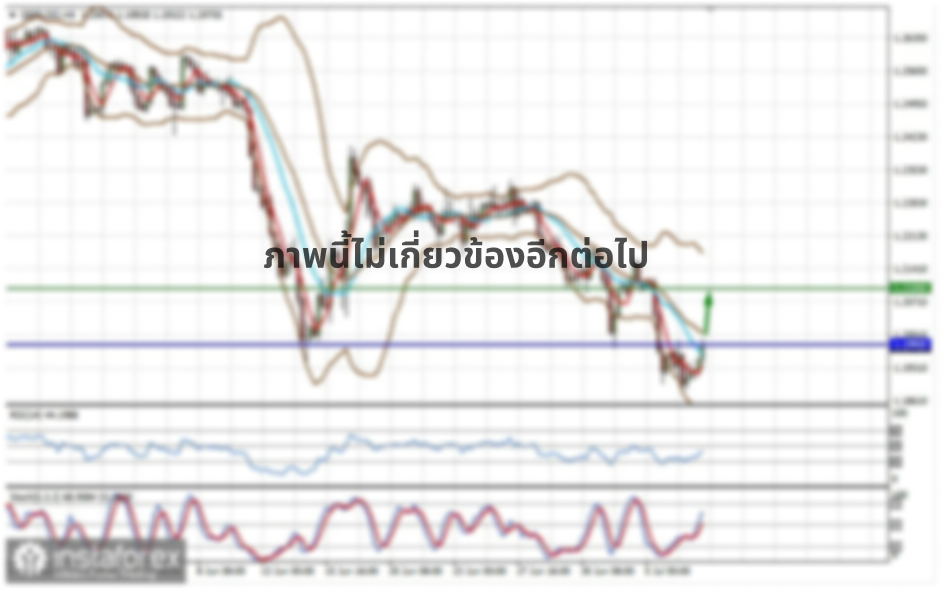
Overview of GBP/USD on August 16th. Forecast according to the "Regression Channels". "British Exit" in three years: nothing has changed

4-hour timeframe

This image is no longer relevant

Technical data:

The upper linear regression channel: direction – down.

The lower linear regression channel: direction – down.

The moving average (20; smoothed) – sideways.

CCI: 90.7831

The political chaos in Britain with the advent of Boris Johnson did not weaken. Literally a month after Johnson's appointment, a vote of no confidence is on the agenda. This vote wants to initiate the leader of the opposition party, Jeremy Corbyn, to protect the UK from disordered Brexit, which according to many experts, economists and analysts led by the Chairman of the British regulator Mark Carney believe that such a scenario would be destructive to the country's economy. However, political laurels do not allow Johnson to sleep at night. He is determined to withdraw the country from the EU on October 31 and is not too worried about how to raise the economy of the Kingdom from its knees in the next 5-10 years. Meanwhile, Donald Trump has announced a "major and fantastic" trade deal with the UK. According to Trump, he already had the honor of having a conversation with Johnson and is going to hold another. Previously, Joe Bolton, US national security adviser, declared that the United States fully supports the "tough" "divorce", if that was what the UK government wanted. Well, a trade deal will be signed after Brexit, but for now, work in this direction may begin at the next G-7 meeting. The US president also said that he considers Great Britain to be one of the closest allies and partners, therefore, "we need to do much more business with it." Unfortunately, the British pound reacts poorly to the seemingly optimistic news about the trade deal with America. But it is constantly in the focus of Brexit. But there are no specific changes in the procedure of Britain's exit from the European Union. We can only wait for the beginning of September when the Parliament will come out of vacation and new information on this topic will begin to arrive. The pound/dollar pair barely fixed above the moving average, but it can resume its decline today. Macroeconomic reports are not expected from the UK today.

Nearest support levels:

S1 – 1.2085

S2 – 1.2054

S3 – 1.2024

Nearest resistance levels:

R1 – 1.2115

R2 – 1.2146

R3 – 1.2177

Trading recommendations:

The GBP/USD pair has fixed below the moving average line, which indicates the readiness of the bears to reactivate and start selling the pound sterling. Therefore, sell orders for the pound/dollar pair are now relevant again with targets at 1.2024 and 1.1993.

In addition to the technical picture, you should also take into account the fundamental data and the time of their release.

Explanation of illustrations:

The upper linear regression channel – the blue line of the unidirectional movement.

The lower linear regression channel – the purple line of the unidirectional movement.

CCI – the blue line in the indicator regression window.

The moving average (20; smoothed) – blue line on the price chart.

Murray levels – multi-colored horizontal stripes.

Haiken Ashi is an indicator that colors bars in blue or purple.

Paolo Greco,
ผู้เชี่ยวชาญด้านการวิเคราะห์ของ InstaForex
© 2007-2025
เลือกช่วงเวลา
5
นาที
15
นาที
30
นาที
1
ชั่วโมง
4
ชั่วโมง
1
วัน
1
สัปดาห์
รับผลกำไรจากการเปลี่ยนแปลงอัตราสกุลเงินดิจิทัลกับ InstaForex.
ดาวน์โหลด MetaTrader 4 และเปิดการซื้อขายครั้งแรกของคุณ.
  • Grand Choice
    Contest by
    InstaForex
    InstaForex always strives to help you
    fulfill your biggest dreams.
    เข้าร่วมการแข่งขัน


บทความแนะนำ

บิทคอยน์: ความแข็งแกร่งของดอลลาร์อาจเป็นสาเหตุให้ตลาดคริปโตเผชิญกับภาวะชะลอตัว

วันนี้ ตลาดจะมีจุดสนใจหลักอยู่ที่การเผยแพร่รายงานเงินเฟ้อของสหรัฐฯ ซึ่งคาดว่าจะไม่ได้แสดงถึงการหยุดการลดลงในช่วงที่ผ่านมา แต่จะแสดงถึงการเพิ่มขึ้นของอัตราเงินเฟ้อที่สูงที่สุดในรอบสี่เดือนที่ผ่านมา ตามการคาดการณ์ทั่วไป อัตราเงินเฟ้อผู้บริโภคทั่วไปในปีนี้คาดว่าจะเพิ่มขึ้นจาก 2.3% เป็น 2.5% ขณะที่อัตราเงินเฟ้อพื้นฐานคาดว่าจะเพิ่มขึ้นจาก 2.8% เป็น 2.9% นี่เป็นสัญญาณเชิงลบสำหรับโทเคน แต่เป็นสัญญาณเชิงบวกสำหรับดอลลาร์สหรัฐฯ

Pati Gani 11:47 2025-06-11 UTC+2

EUR/USD. 11 มิถุนายน. สหรัฐฯ และจีนไม่ได้บรรลุข้อตกลงใด ๆ

เมื่อวันอังคาร คู่เงิน EUR/USD ยังคงเคลื่อนไหวในทิศทางขนานระหว่างระดับ 1.1380 และ 1.1454 การดีดตัวใหม่จากระดับ Fibonacci retracement ที่ 61.8% ที่ 1.1380 ช่วยให้เกิดการขึ้นภายในช่วงนี้

Samir Klishi 11:12 2025-06-11 UTC+2

GBP/USD. วันที่ 11 มิถุนายน ตกงานในสหราชอาณาจักรและอัตราเงินเฟ้อในสหรัฐอเมริกา

บนกราฟรายชั่วโมง คู่เงิน GBP/USD ยังคงปรับตัวลดลงในวันอังคาร โดยได้ยืนตัวต่ำกว่าระดับ 161.8% Fibonacci ที่ 1.3520 และดีดตัวขึ้นจากด้านล่าง ดังนั้น การปรับตัวลดลงอาจดำเนินต่อไปในวันนี้ไปยังระดับถัดไปที่ 1.3425 การยืนเหนือระดับ 1.3520

Samir Klishi 10:56 2025-06-11 UTC+2

การวิเคราะห์ทางเทคนิคของการเคลื่อนไหวของราคาในกรอบเวลาระหว่างวันของคู่สกุลเงินครอส AUD/JPY วันพุธที่ 11 มิถุนายน 2025

จากสิ่งที่เห็นบนกราฟ 4 ชั่วโมง คู่สกุลเงิน AUD/JPY มีแนวโน้มของ Divergence ระหว่างการเคลื่อนที่ของราคากับดัชนี Stochastic Oscillator ดังนั้นในอนาคตอันใกล้นี้ AUD/JPY มีแนวโน้มที่จะอ่อนค่าลงไปที่ระดับ 93.84 หากระดับนี้ถูกทะลุและปิดต่ำกว่า

Arief Makmur 09:28 2025-06-11 UTC+2

การวิเคราะห์ทางเทคนิคของการเคลื่อนไหวของราคาในแต่ละวันของคู่สกุลเงินแปลกใหม่ USD/IDR, วันพุธที่ 11 มิถุนายน 2025

มีข้อมูลบางอย่างที่น่าสนใจเกี่ยวกับ USD/IDR ในขณะนี้ ประการแรก การเคลื่อนไหวของราคาของ USD/IDR กำลังเคลื่อนที่ต่ำกว่า WMA (21) ประการที่สอง การปรากฏของรูปแบบ Bearish 123 ซึ่งตามมาด้วย Bearish

Arief Makmur 09:28 2025-06-11 UTC+2

สัญญาณการเทรดสำหรับ BITCOIN (BTC/USD) สำหรับวันที่ 11-13 มิถุนายน: ขายต่ำกว่า $110,700 (21 SMA - 200 EMA)

บิตคอยน์กำลังซื้อขายอยู่ที่ประมาณ 110,726 กำลังมีการปรับฐานทางเทคนิคหลังจากขึ้นถึง 110,726 ซึ่งเป็นระดับที่เห็นได้เมื่อสิ้นเดือนพฤษภาคม บิตคอยน์ได้สร้างรูปแบบกราฟแบบ double top ขึ้น ดังนั้นเราคิดว่าถ้าราคาอยู่ต่ำกว่า 110,700 อาจมีการปรับฐานทางเทคนิคไปที่ 107,586 และอาจถึง 104,146

Dimitrios Zappas 05:16 2025-06-11 UTC+2

สัญญาณการซื้อขายสำหรับทองคำ (XAU/USD) วันที่ 11-14 มิถุนายน 2025 ขายเมื่อราคาต่ำกว่า $3,340 (ค่าเฉลี่ยเคลื่อนที่ 21 วัน - 7/8 Murray)

ช่วงต้นของการซื้อขายในตลาดยุโรป ทองคำกำลังซื้อขายอยู่ที่ประมาณ 3,334 ซึ่งแสดงให้เห็นถึงความอ่อนแรง หลังจากที่ได้เด้งขึ้นมาจาก 3,300 ในช่วงการซื้อขายของตลาดอเมริกาเมื่อวาน ระดับราคานี้ของทองคำถือว่าเป็นจุดสำคัญ เนื่องจากเราอาจคาดการณ์ว่าจะมีการปรับฐานทางเทคนิคต่ำกว่าบริเวณนี้ ในกราฟแสดงให้เห็นว่ากำลังพยายามที่จะทะลุจุดสูงสุดของช่องแนวโน้มขาขึ้น อย่างไรก็ตาม เนื่องจากปริมาณการซื้อขายและสภาพคล่องที่ต่ำ อาจจะมีการปรับฐานทางเทคนิคตามมา ระดับนี้อาจถือว่าสำคัญสำหรับนักลงทุนที่มีมุมมองขาลง เนื่องจากสามารถกดดันให้ราคาทองคำลดลงจนถึงช่องว่างที่เหลืออยู่ที่

Dimitrios Zappas 05:09 2025-06-11 UTC+2

พยากรณ์ EUR/USD สำหรับวันที่ 11 มิถุนายน 2025

เมื่อวานนี้ ดอลลาร์สหรัฐพยายามที่จะกดดันให้ยูโรลงไปต่ำกว่าระดับแนวรับทางเทคนิคสำคัญที่ถูกทำเครื่องหมายโดยเส้นสมดุลรายวันและเส้นบ่งชี้ MACD แต่ยูโรกลับทนต่อแรงกดดันและปิดวันอยู่เหนือระดับแนวต้านที่ 1.1420 วันนี้ราคาเปิดตลาดเหนือระดับนี้ และเส้นชี้วัดกำลังบ่งชี้ถึงช่วงเวลาสำคัญ: นี่คือวันสุดท้ายที่สกุลเงินเดียวจะสามารถพัฒนาการเคลื่อนไหวขึ้นได้ เนื่องจากราคาตอนนี้อยู่ที่จุดสูงสุดของรูปสามเหลี่ยม ซึ่งเกิดจากระดับเป้าหมายและเส้น MACD หากแท่งเทียนของวันนี้เป็นขาลง (หรือวันที่ "ดำ") เป้าหมายอยู่ที่

Laurie Bailey 04:41 2025-06-11 UTC+2

การคาดการณ์ค่าเงิน GBP/USD สำหรับวันที่ 11 มิถุนายน 2025

ข้อมูลการจ้างงานของสหราชอาณาจักรเมื่อวานสำหรับเดือนพฤษภาคมแสดงให้เห็นว่าอัตราการว่างงานเพิ่มขึ้นจาก 4.5% เป็น 4.6% พร้อมทั้งการเพิ่มขึ้นของจำนวนผู้ขอรับสวัสดิการการว่างงานอีก 33,100 ราย ส่งผลให้ค่าเงินปอนด์ลดลง 50 จุด เส้นสัญญาณของ Marlin oscillator ได้ทะลุลงด้านล่างจากช่องของตนเองและกำลังทดสอบขอบเขตของโซนแนวโน้มขาลง Marlin

Laurie Bailey 04:41 2025-06-11 UTC+2

การคาดการณ์ราคาซิลเวอร์ สำหรับวันที่ 11 มิถุนายน 2025

ตลอดเจ็ดช่วงที่ผ่านมา ราคาของเงินได้มีการปรับตัวสูงขึ้นอย่างมีนัยสำคัญ แต่ศักยภาพในการเติบโตยังไม่หมด ตัวเป้าหมายที่ระดับ 38.500 ซึ่งเป็นขอบบนของช่องทางราคานั้นยังคงอยู่ในแผนการ ตัวชี้วัด Marlin oscillator ยังไม่เข้าสู่เขตที่ซื้อมากเกินไป แต่ได้ปรับตัวเล็กน้อยเพื่อปลดปล่อยความตึงในเตรียมพร้อมสำหรับการเคลื่อนไหวขึ้นต่อไป การทะลุผ่านแนวต้านถัดไปที่ระดับ 36.84 จะส่งสัญญาณว่าราคาพร้อมที่จะขึ้นต่อเนื่อง บนกราฟสี่ชั่วโมง

Laurie Bailey 04:41 2025-06-11 UTC+2
หากไม่สะดวกคุยในตอนนี้
ระบุคำถามไว้ได้ใน แชท.
Widget callback
 

Dear visitor,

Your IP address shows that you are currently located in the USA. If you are a resident of the United States, you are prohibited from using the services of InstaFintech Group including online trading, online transfers, deposit/withdrawal of funds, etc.

If you think you are seeing this message by mistake and your location is not the US, kindly proceed to the website. Otherwise, you must leave the website in order to comply with government restrictions.

Why does your IP address show your location as the USA?

  • - you are using a VPN provided by a hosting company based in the United States;
  • - your IP does not have proper WHOIS records;
  • - an error occurred in the WHOIS geolocation database.

Please confirm whether you are a US resident or not by clicking the relevant button below. If you choose the wrong option, being a US resident, you will not be able to open an account with InstaForex anyway.

We are sorry for any inconvenience caused by this message.