empty
26.02.2020 04:04 AM
Comprehensive analysis of movement options of #USDX vs AUD/USD vs USD/CAD vs NZD/USD (H4) on February 26, 2020

Minuette operational scale (H4)

Here's a comprehensive analysis of development options for the movement of the dollar index and commodity currency instruments #USDX vs AUD / USD vs USD / CAD vs NZD / USD in the last week of a leap winter.

____________________

US dollar index

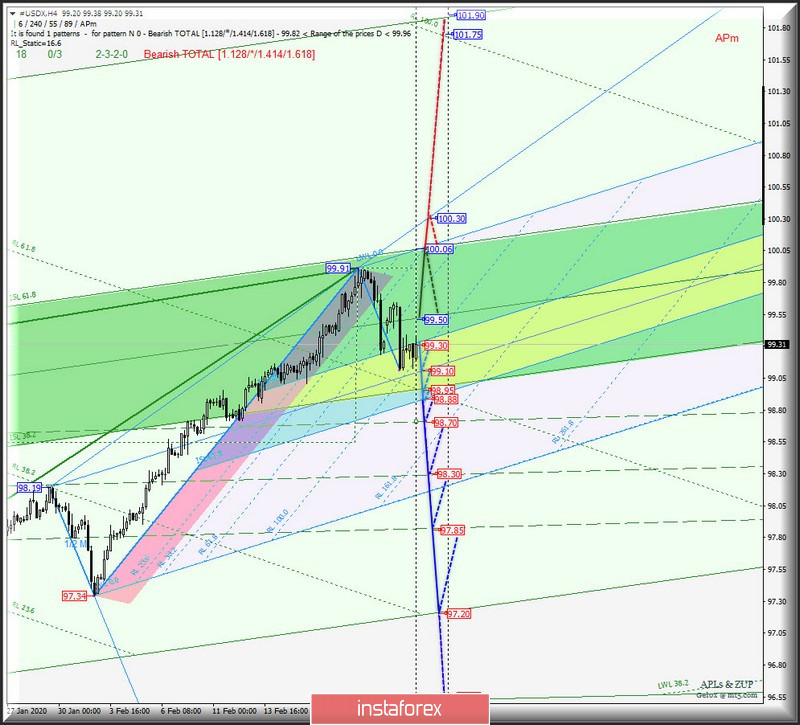
The movement of the dollar index #USDX from February 26, 2020 will be determined by the direction of the breakdown of the range :

  • resistance level of 99.50 - 1/2 Median Line Minuette;
  • support level of 99.30 - the upper boundary of the ISL38.2 equilibrium zone of the Minuette operational scale forks.

In case of breakdown of ISL38.2 Minuette - support level of 99.30, the development of the dollar index movement will continue in the equilibrium zone (99.30 - 99.10 - 98.88) of the Minuette operational scale forks with the prospect of reaching the boundaries of 1/2 Median Line channel (98.70 - 98.30 - 97.85) of the Minuette operational scale forks and start line SSL Minuette (97.20).

On the other hand, in case of breakdown of the 1/2 Median Line Minuette - resistance level of 99.50 - will lead to the continuation of the development of the upward movement #USDX towards the goals:

- the upper boundary of ISL61.8 (100.06) equilibrium zone of the Minuette operational scale forks;

- control line UTL (100.30) of the Minuette operational scale forks.

The markup of #USDX movement options from February 26, 2020 is shown on the animated chart.

This image is no longer relevant

____________________

Australian dollar vs US dollar

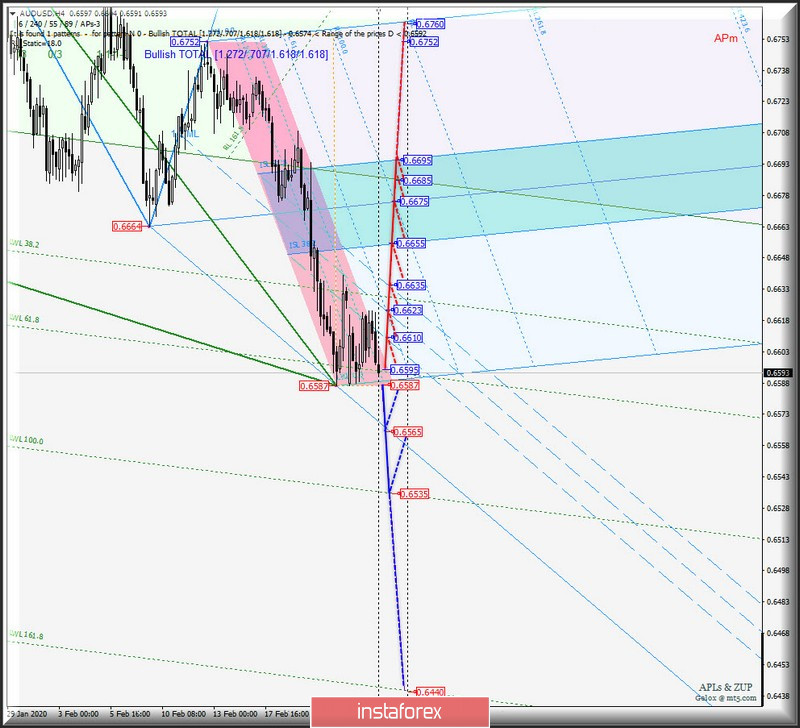
The development and the breakdown of the range :

  • resistance level of 0.6595 - warning line LWL61.8 of the Minuette operational scale forks;
  • support level of 0.6587 - start line SSL of the Minuette operational scale forks

will begin to determine the development of the movement of the Australian dollar AUD / USD from February 26, 2020.

The breakdown of the warning line LWL61.8 of the Minuette operational scale forks - resistance level 0.6595 - is an option for the movement of the Australian dollar to the boundaries of the 1/2 Median Line channel (0.6610 - 0.6623 - 0.6635) and the equilibrium zone (0.6655 - 0.6675 - 0.6695) of the Minuette operational scale forks.

Meanwhile, in case of breakdown of the initial line of SSL of the Minuette operational scale forks - support level 0.6587 - the downward movement of AUD / USD can be continued to the control line LTL Minuette (0.6565) and the warning line LWL100.0 (0.6535) oof the Minuette operational scale forks.

We look at the layout of the AUD / USD movement options from February 26, 2020 on the animated chart.

This image is no longer relevant

____________________

US dollar vs Canadian dollar

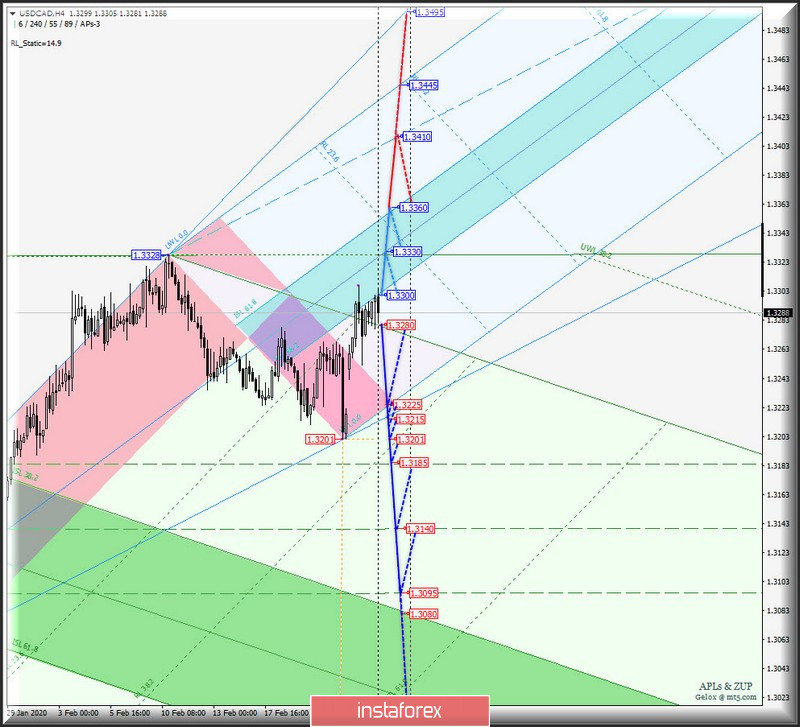
Starting from February 26, 2020, the Canadian dollar USD / CAD will continue its movement depending on the direction of the breakdown of the range :

  • resistance level of 1.3300 - lower boundary of the ISL38.2 equilibrium zone of the Minuette operational scale forks;
  • support level of 1.3280 - start line SSL of the Minuette operational scale forks.

The breakdown of the support level of 1.3280 on the initial SSL line of the Minuette operational scale forks will make it relevant to continue the development of the downward movement of the Canadian dollar to the goals:

- the initial SSL Minuette line (1.3225);

- control line LTL Minuette (1.3215);

- local minimum 1.3201;

- 1/2 Median Line Minuette channel (1.3185 - 1.3140 - 1.3095).The breakdown of the resistance level of 1.3300 on the ISL38.2 Minuette will lead to the development of the USD / CAD movement in the equilibrium zone (1.3300 - 1.3330 - 1.3360) of the Minuette operational scale forks with the prospect of reaching the final Schiff Line Minuette (1.3410).

We look at the markup of USD / CAD movement options from February 26, 2020 on the animated chart.

This image is no longer relevant

____________________

New Zealand dollar vs US dollar

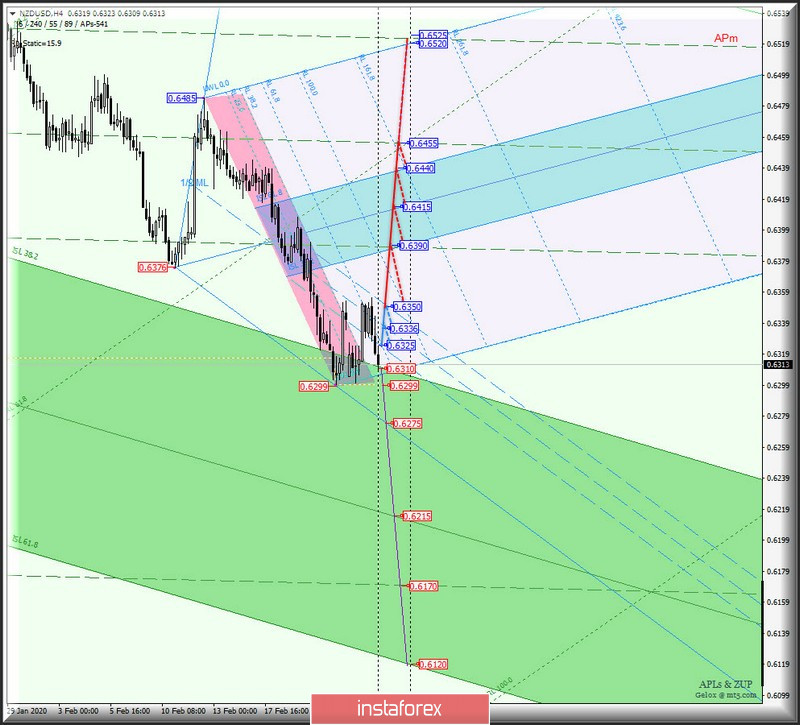
On February 26, 2020, the development of the movement of the New Zealand dollar NZD / USD will depend on the development and direction of the breakdown of the range :

  • resistance level of 0.6325 (lower boundary of the 1/2 Median Line channel of the Minuette operational scale forks);
  • support level of 0.6310 (upper boundary of the ISL38.2 equilibrium zone of the Minuette operational scale forks).

In case of breakdown of the resistance level of 0.6325, the NZD / USD movement will continue in the 1/2 Median Line Minuette channel (0.6325 - 0.6336 - 0.6350) with the prospect of reaching the boundaries of the equilibrium zone (0.6390 - 0.6415 - 0.6440)of the Minuette operational scale forks.

Alternatively, with the breakdown of the support level of 0.6310 on ISL38.2 Minuette, the development of the movement of the New Zealand dollar in the equilibrium zone (0.6310 - 0.6215 - 0.6120) of the Minuette operational scale forks will be relevant, taking into account the development of the control line LTL Minuette (0.6275) and the final Schiff Line Minuette (0.6170).

We look at the layout of the NZD / USD movement options from February 26, 2020 on the animated chart.

This image is no longer relevant

____________________

The review was compiled without taking into account the news background. Thus, the opening trading sessions of major financial centers does not serve as a guide to action (placing orders " sell " or " buy ")

The formula for calculating the dollar index:

USDX = 50.14348112 * USDEUR0.576 * USDJPY0.136 * USDGBP0.119 * USDCAD0.091 * USDSEK0.042 * USDCHF0.036.

where the power coefficients correspond to the weights of the currencies in the basket:

Euro - 57.6%;

Yen - 13.6%;

Pound Sterling - 11.9%;

Canadian dollar - 9.1%;

Swedish krona - 4.2%;

Swiss franc - 3.6%.

The first coefficient in the formula leads the index to 100 at the start date of the countdown - March 1973, when the main currencies began to be freely quoted relative to each other.

Ratu Taslim,
ผู้เชี่ยวชาญด้านการวิเคราะห์ของ InstaForex
© 2007-2025
เลือกช่วงเวลา
5
นาที
15
นาที
30
นาที
1
ชั่วโมง
4
ชั่วโมง
1
วัน
1
สัปดาห์
รับผลกำไรจากการเปลี่ยนแปลงอัตราสกุลเงินดิจิทัลกับ InstaForex.
ดาวน์โหลด MetaTrader 4 และเปิดการซื้อขายครั้งแรกของคุณ.
  • Grand Choice
    Contest by
    InstaForex
    InstaForex always strives to help you
    fulfill your biggest dreams.
    เข้าร่วมการแข่งขัน


บทความแนะนำ

คาดการณ์สำหรับ EUR/USD ในวันที่ 11 กรกฎาคม 2025

เมื่อวันพฤหัสบดี คู่สกุลเงิน EUR/USD ยังคงปรับตัวลดลงไปยังระดับ 1.1645 ขณะที่ระดับการแก้ไข Fibonacci ที่ 127.2% ที่ 1.1712 ส่วนใหญ่ถูกละเลยโดยผู้ค้า การฟื้นตัวจากระดับ 1.1645 จะเอื้อประโยชน์ให้กับเงินยูโรและอาจนำไปสู่การเพิ่มขึ้นในระดับปานกลางไปยัง

Samir Klishi 12:44 2025-07-11 UTC+2

การคาดการณ์ GBP/USD วันที่ 11 กรกฎาคม 2025

ในกราฟรายชั่วโมง คู่สกุลเงิน GBP/USD เมื่อวันพฤหัสบดีได้ดีดตัวจากแนวต้านที่ระดับ 1.3611–1.3633 และกลับมาเคลื่อนไหวลดลงไปที่ระดับ 127.2% ของ Fibonacci ที่ 1.3527 การดีดตัวจากระดับนี้จะส่งผลดีต่อฝ่ายปอนด์และอาจทำให้ราคากลับขึ้นไปที่ระดับ 1.3611–1.3633 ได้ การปิดต่ำกว่าระดับ

Samir Klishi 12:20 2025-07-11 UTC+2

แม้จะมีโอกาสในการปรับฐาน แต่ทองคำยังมีศักยภาพที่จะเพิ่มขึ้นในวันนี้ วันศุกร์ที่ 11 กรกฎาคม 2025

XAU/USD, วันศุกร์ที่ 11 กรกฎาคม 2025 แม้ว่าดูเหมือนว่าจะปรับฐานเนื่องจากถูกถือไว้ที่แนวต้าน 1 แต่ด้วยสภาวะทางเทคนิคและปัจจัยพื้นฐานที่แข็งแกร่งต่อเนื่องของ XAU/USD เปิดโอกาสให้ XAU/USD ยังมีแนวโน้มแข็งค่าต่อไปได้ ระดับที่สำคัญ 1. แนวต้าน

Arief Makmur 08:00 2025-07-11 UTC+2

การคาดการณ์สำหรับ EUR/USD วันที่ 11 กรกฎาคม 2025

บนกราฟรายสัปดาห์ของ EUR/USD เราพบชุดสัญญาณการกลับตัวที่ประกอบไปด้วย: การเกิด divergence, การเปลี่ยนแปลงแนวโน้มในโซนเวลาฟีโบนัชชี, และการดีดตัวของราคาเมื่อเกิดการตัดกันระหว่างสองเส้นที่แข็งแกร่ง — ขอบเขตของช่องราคากับรังสีฟีโบนัชชี. หากสัปดาห์ปิดแม้อยู่ที่ระดับปัจจุบัน แนวถนนระยะยาวขาลง (มุ่งสู่ 0.9260) จะเปิดสำหรับยูโร บนกราฟรายวัน

Laurie Bailey 06:58 2025-07-11 UTC+2

การพยากรณ์ GBP/USD สำหรับวันที่ 11 กรกฎาคม 2025

บนกราฟรายเดือน GBP/USD ปอนด์อังกฤษได้ปรับตัวกลับจากระดับตอบสนองฟีโบนักชีที่ 161.8% ซึ่งคำนวณจากขอบด้านบนของช่องราคาทั่วโลกในระยะเวลา 18 ปีทันทีหลังจากเส้นเวลา Fibonacci เส้นที่ 8 ค่าเงินปอนด์อาจเผชิญกับการลดลงในระยะยาว ซึ่งอาจจะเป็นไปได้ถึงขั้นที่น่ากังวลไปจนถึงระดับที่เสมอภาคได้ บนกราฟรายสัปดาห์ เราได้สังเกตการแยกตัวและระดับเป้าหมายที่อยู่ใกล้สองระดับ (เมื่อเทียบกับช่วงเวลานี้)

Laurie Bailey 06:46 2025-07-11 UTC+2

การคาดการณ์สำหรับ USD/CAD ในวันที่ 11 กรกฎาคม 2025

USD/CAD ดอลลาร์แคนาดาได้มีการเคลื่อนไหวแบบสะสมตัวเป็นเวลาสามวันก่อนที่จะมีการกระทำแบบฝ่าขึ้นในช่วงการซื้อขายแปซิฟิกวันนี้ ราคาได้ทะลุผ่านเส้นสมดุลด้วยเงาบนของมัน หลังจากหยุดชั่วคราวที่เส้นศูนย์ เส้นสัญญาณของออสซิลเลเตอร์ Marlin ได้เริ่มเพิ่มขึ้นอย่างมั่นใจแล้ว ดูเหมือนว่าราคากำลังมุ่งหน้าไปยังระดับเป้าหมายที่ 1.3860 ซึ่งเป็นระดับสูงสุดตั้งแต่วันที่ 29 พฤษภาคม หากนี่เป็นการกลับตัวของแนวโน้ม หรือแม้แต่การแก้ไขเชิงลึก จุดต้านทานที่ใกล้ที่สุดซึ่งอยู่ระหว่าง

Laurie Bailey 06:42 2025-07-11 UTC+2

การคาดการณ์คู่สกุลเงิน EUR/USD สำหรับวันที่ 10 กรกฎาคม 2025

เมื่อวันพุธ คู่เงิน EUR/USD ยังคงเคลื่อนตัวไปในแนวทางที่มีเพียงตนเองรู้ ระดับการปรับตัว 127.2% ของ Fibonacci ที่ 1.1712 ถูกเพิกเฉยจากนักเทรดอีกครั้ง ฉันยังคงไม่แนะนำให้ใช้เป็นตัวอ้างอิงสำหรับสัญญาณการซื้อขาย—ยกเว้นอาจจะเป็นสัญญาณซื้อ เนื่องจากพื้นหลังของข่าวปัจจุบันยังคงสนับสนุนการเติบโตของเงินยูโร ในช่วงไม่กี่สัปดาห์ที่ผ่านมา ฝ่ายขายยังไม่สามารถแสดงความแข็งแกร่งที่แท้จริงออกมาได้

Samir Klishi 12:21 2025-07-10 UTC+2

การพยากรณ์สำหรับ GBP/USD ในวันที่ 10 กรกฎาคม 2025

บนกราฟหนึ่งชั่วโมงในวันพุธ คู่เงิน GBP/USD ยังคงเคลื่อนไหวในทิศทางขาขึ้นต่อเนื่องหลังจากดีดตัวจากระดับการปรับค่า Fibonacci ที่ 127.2% ที่ 1.3527 การดีดตัวนี้เกิดขึ้นอย่างแม่นยำ นำไปสู่การกลับตัวที่เป็นบวกต่อเงินปอนด์อังกฤษและกลับไปที่ระดับแนวต้านที่ 1.3611–1.3633 ฉันมั่นใจพอสมควรว่าระดับนี้จะถูกทะลุในอนาคตอันใกล้—อาจจะแม้แต่วันนี้ ภูมิหลังของข้อมูลในสัปดาห์นี้ทำให้ดอลลาร์สหรัฐรักษาแรงดึงตัวที่เพิ่มขึ้นล่าสุดได้ยาก การปิดเหนือระดับ

Samir Klishi 10:35 2025-07-10 UTC+2

GBP/JPY: การวิเคราะห์ การคาดการณ์ และสถานการณ์ตลาดปัจจุบัน

เมื่อวันพฤหัสบดี คู่สกุลเงิน GBP/JPY ได้รับแรงหนุนให้กลับมาสู่แนวโน้มขาขึ้นอีกครั้งและแสดงสัญญาณความพร้อมสำหรับการขยายตัวต่อไป การก่อตัวของช่องทางขาขึ้นยืนยันถึงความมั่นคงของแนวโน้มขาขึ้นนี้ ในช่วงการซื้อขายเอเชีย ผู้ซื้อมีความกระตือรือร้นมากขึ้นใกล้ระดับ 198.40–198.35 ซึ่งช่วยจำกัดการปรับตัวลดลงจากระดับสูงสุดของปีที่เคยถึงในช่วงก่อนหน้า คู่สกุลเงินนี้ปัจจุบันเคลื่อนที่อยู่รอบระดับจิตวิทยาที่ 199.00 และยังคงมีแนวโน้มขาขึ้น ในช่วงสองเดือนที่ผ่านมา คู่สกุลเงินนี้เคลื่อนที่ภายในช่องทางขาขึ้นซึ่งบ่งบอกถึงการเติบโตอย่างต่อเนื่อง ตัววัดสัญญาณออสซิลเลเตอร์ในกราฟรายวันยังคงอยู่ในดินแดนบวกและยังไม่เข้าสู่สภาวะที่ซื้อมากเกินไป

Irina Yanina 10:22 2025-07-10 UTC+2

หากแนวต้านที่ระดับ 0.7964 สามารถหยุดยั้งการเคลื่อนไหวขึ้นได้ USD/CHF มีแนวโน้มที่จะอ่อนตัวลงในวันพฤหัสบดีที่ 10 กรกฎาคม 2025

USD/CHF, วันพฤหัสบดีที่ 10 กรกฎาคม 2025 นอกจากข่าวลือเกี่ยวกับการตัดสินใจลดอัตราดอกเบี้ยของ Fed และการลดลงของอัตราดอกเบี้ยพันธบัตรรัฐบาลสหรัฐ USD/CHF ลดลงในวันนี้ ระดับที่สำคัญ 1. แนวต้าน 2: 0.7990

Arief Makmur 06:47 2025-07-10 UTC+2
หากไม่สะดวกคุยในตอนนี้
ระบุคำถามไว้ได้ใน แชท.
Widget callback
 

Dear visitor,

Your IP address shows that you are currently located in the USA. If you are a resident of the United States, you are prohibited from using the services of InstaFintech Group including online trading, online transfers, deposit/withdrawal of funds, etc.

If you think you are seeing this message by mistake and your location is not the US, kindly proceed to the website. Otherwise, you must leave the website in order to comply with government restrictions.

Why does your IP address show your location as the USA?

  • - you are using a VPN provided by a hosting company based in the United States;
  • - your IP does not have proper WHOIS records;
  • - an error occurred in the WHOIS geolocation database.

Please confirm whether you are a US resident or not by clicking the relevant button below. If you choose the wrong option, being a US resident, you will not be able to open an account with InstaForex anyway.

We are sorry for any inconvenience caused by this message.