empty
25.11.2021 08:47 PM
Trading plan for EUR/USD for November 26, 2021. Trading tips for novice

Analysis of Thursday trades:

M30 chart

This image is no longer relevant

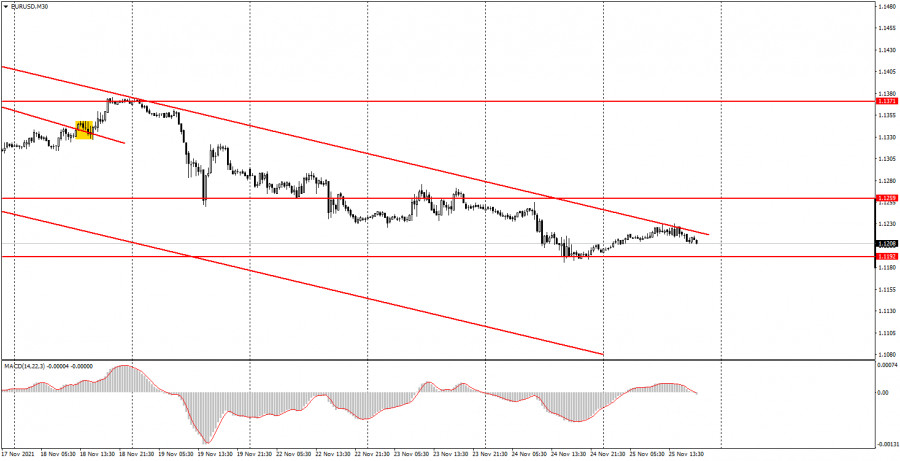
EUR/USD was mainly flat on Thursday, which was clearly seen on any time frame. The daily volatility of the pair was about 30 pips. So, it was a relatively calm day in the market. In terms of macroeconomic statistics, the calendar was completely empty both in the United States and the European Union. The same goes for fundamentals: ECB President Christine Lagarde's only speech, who speaks almost every day in recent weeks, could hardly trigger market jitters. Judging from all the above, the pair is likely to remain bearish on Friday. However, the quote might leave the descending channel, which would mean the end of the downtrend. Anyway, the price bounced from the upper line of this channel, generating a sell signal. A similar signal was also produced on the M5 chart.

M5 chart

This image is no longer relevant

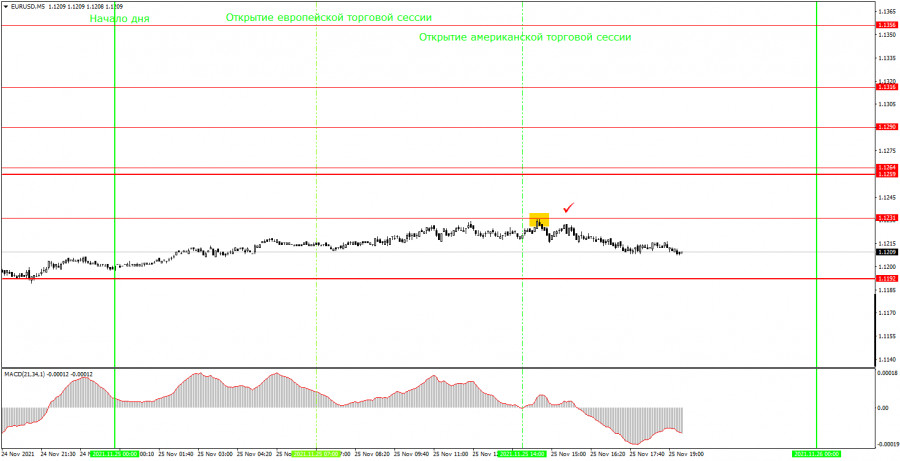
According to the M5 chart, the quote rose by 20 pips from its low to its high during the European and North American sessions. Nevertheless, it managed to form a sell signal within the day. As it was not a false signal, traders did not incur losses. It is about a bounce from 1.1231 at the beginning of the North American session. Short positions opened there brought a 15 pips profit. Yet, the price failed to test the nearer target and trades were to be closed manually in the evening. No more signals were generated that day.

Outlook for EUR/USD:

On the M30 chart, a clear downtrend is seen. In other words, the pair is likely to extend its downward movement. So, short positions could be opened until consolidation above the channel. On the M5 chart, the key levels on November 26 are 1.1192, 1.1231, 1.1259 – 1.1264. There are simply no other levels below because the price has not been there for about a year. A Take-profit order is to be set at a distance of 30-40 pips. A Stop-loss order is to be placed at the breakeven point when the quote passes 15 points in the required direction. On the M5 chart, the target is seen at the nearest level if it is not located too close or too far. Otherwise, you should take it from there. On Friday, ECB's Christine Lagarde will again deliver a speech and this is going to be the only event to attract market participants' attention. No important events are scheduled in the US. For that reason, the pair is not expected to show high volatility or any sharp movement on Friday.

Major rules of trading strategy:

1) The strength of a signal is calculated by the time it took a signal to form (bounce or break through the level). The less time it takes, the stronger is the signal.

2) If two or more trades are opened near a certain level based on false signals (which did not trigger a Take Profit order or a test of the nearest target level), then all subsequent signals from this level should be ignored.

3) Being flat, any pair might form a lot of false signals or non at all. In any case, when seeing the first signs of a flat, trading should be stopped.

4) Trades are opened within the time period between the opening of the European session and the middle of the North American session when all trades should be closed manually.

5) On the M30 chart, trading should be carried out based on signals from the MACD indicator only if there is good volatility or a trend confirmed by a trend line or a channel.

6) If two levels are located close to one another (from 5 to 15 pips), they should be considered as the area of support or resistance.

Indicators on charts:

Support and resistance are target levels when buying or selling a pair. A Take-profit order could be set near them.

Red lines are channels or trend lines that display the current trend and show in what direction it is preferable to trade now.

MACD (14, 22, 3) - a histogram and a signal line, the crossing of which produces a signal to enter the market. It should be used in combination with trend patterns (channels, trend lines).

Important speeches and reports (always contained in the calendar) can greatly influence the movement of a currency pair. Therefore, at the time of publication, market players should trade very cautiously or exit the market to avoid a reversal.

Beginners should remember that not every trade will be profitable. An effective trading strategy and money management are the keys to success in long-term trading.

Paolo Greco,
ผู้เชี่ยวชาญด้านการวิเคราะห์ของ InstaForex
© 2007-2025
เลือกช่วงเวลา
5
นาที
15
นาที
30
นาที
1
ชั่วโมง
4
ชั่วโมง
1
วัน
1
สัปดาห์
รับผลกำไรจากการเปลี่ยนแปลงอัตราสกุลเงินดิจิทัลกับ InstaForex.
ดาวน์โหลด MetaTrader 4 และเปิดการซื้อขายครั้งแรกของคุณ.
  • Grand Choice
    Contest by
    InstaForex
    InstaForex always strives to help you
    fulfill your biggest dreams.
    เข้าร่วมการแข่งขัน


บทความแนะนำ

GBP/USD: แผนการเทรดสำหรับการซื้อขายในช่วงสหรัฐวันที่ 4 มิถุนายน (ตรวจสอบการซื้อขายในช่วงเช้า)

ในการคาดการณ์ตอนเช้าของฉัน ฉันมุ่งเน้นไปที่ระดับ 1.3536 และวางแผนที่จะตัดสินใจด้านการซื้อขายตามนั้น มาดูกราฟ 5 นาทีและดูว่าเกิดอะไรขึ้น การเพิ่มขึ้นและการก่อตัวของการฝ่าทะลุที่ผิดพลาดรอบๆ 1.3536 ทำให้เกิดจุดเข้าซื้อเพื่อขายเงินปอนด์ ส่งผลให้คู่เงินลดลง 15 จุด ภาพทางเทคนิคไม่ได้รับการแก้ไขสำหรับช่วงครึ่งหลังของวัน การเปิดตำแหน่งซื้อ

Miroslaw Bawulski 14:20 2025-06-04 UTC+2

EUR/USD: แผนการเทรดสำหรับช่วงการซื้อขายในสหรัฐอเมริกา วันที่ 4 มิถุนายน (รีวิวการซื้อขายช่วงเช้า)

ในคำทำนายตอนเช้าของฉัน ฉันได้เน้นที่ระดับ 1.1391 และวางแผนที่จะใช้ในการตัดสินใจซื้อขาย มาดูกราฟ 5 นาทีและวิเคราะห์สิ่งที่เกิดขึ้น การเพิ่มขึ้นและการเกิดขึ้นของการทะลุหลอกใกล้กับ 1.1391 ทำให้มีจุดเข้าซื้อขายเมื่อขายยูโร แต่ตามที่เห็นบนกราฟ ไม่มีการลดลงที่มีนัยสำคัญในคู่เงิน รูปการณ์ทางเทคนิคได้ถูกปรับแก้สำหรับช่วงครึ่งหลังของวัน เพื่อเปิดตำแหน่ง Long

Miroslaw Bawulski 14:16 2025-06-04 UTC+2

วิธีการซื้อขายคู่สกุลเงิน GBP/USD วันที่ 4 มิถุนายน? เคล็ดลับง่าย ๆ และการวิเคราะห์การซื้อขายสำหรับผู้เริ่มต้น

เมื่อวันอังคารที่ผ่านมา คู่เงิน GBP/USD มีการลดลงเพียงเล็กน้อย ซึ่งคาดว่าเนื่องจากปัจจัยทางเทคนิค แม้แต่ในกรอบเวลาชั่วโมงก็เห็นชัดว่าค่าเงินปอนด์ของอังกฤษยังคงลดลงอย่างไม่เต็มใจ ตัวอย่างเช่น ยูโรอย่างน้อยยังมีการแก้ไขเป็นบางครั้ง แต่ค่าเงินปอนด์อังกฤษนี้แทบจะเคลื่อนโดยปราศจากการแก้ไขเลย ดังนั้น รายงาน JOLTs ที่มีความเชิงบวกจากสหรัฐอเมริกาเพียงรายงานเดียวนี้จึงไม่เพียงพอที่จะทำให้สถานการณ์ของดอลลาร์ที่กำลังแย่ดีขึ้นอย่างชัดเจน เราเชื่อว่าแนวโน้มขาขึ้นยังคงอยู่โดยไม่มีทางเลือกอื่น แม้ว่าราคายังคงปิดตัวต่ำกว่าเส้นแนวโน้ม

Paolo Greco 07:27 2025-06-04 UTC+2

วิธีการเทรดคู่เงิน EUR/USD ในวันที่ 3 มิถุนายน? เคล็ดลับง่ายๆ และการวิเคราะห์การเทรดสำหรับผู้เริ่มต้น

เมื่อวันอังคาร คู่สกุลเงิน EUR/USD ยังคงมีการซื้อขายในแนวโน้มขาลง หากต้องการ อาจอธิบายการเพิ่มขึ้นของค่าเงินดอลลาร์สหรัฐเพียง "50 จุด" ได้อย่างง่ายดาย อัตราเงินเฟ้อในยูโรโซนลดลงต่ำกว่า 1.9% ต่อปี ซึ่งแทบจะรับประกันได้ 100% ว่าธนาคารกลางยุโรปจะลดอัตราดอกเบี้ยในวันพรุ่งนี้

Paolo Greco 07:27 2025-06-04 UTC+2

คำแนะนำและการวิเคราะห์การซื้อขายสำหรับ GBP/USD ในวันที่ 4 มิถุนายน: เงินปอนด์ไม่ถอยห่างมาก

ในวันอังคาร คู่สกุลเงิน GBP/USD แสดงการเคลื่อนไหวในทิศทางขาลง แต่การปรับตัวลงและความผันผวนของวันนั้นอยู่ในระดับต่ำ ตลาดดูเหมือนจะละเลยปัจจัยพื้นฐานทางเศรษฐกิจ โดยมีเพียงการตอบสนองเล็กน้อยจากนักเทรดที่ได้รับแรงจากรายงาน JOLTs ในสหรัฐฯ ซึ่งแสดงจำนวนงานที่เปิดรับเกินกว่าที่คาดการณ์ ทำให้ดอลล่าร์แข็งค่าขึ้นเล็กน้อย โดยภาพรวมแล้ว ทุกอย่างยังคงเหมือนเดิม หากปอนด์อังกฤษอ่อนตัวลง มันก็จะอ่อนลงเพียงเล็กน้อยและในเวลาสั้น

Paolo Greco 03:41 2025-06-04 UTC+2

คำแนะนำและการวิเคราะห์การซื้อขายสำหรับ EUR/USD ณ วันที่ 4 มิถุนายน: อัตราเงินเฟ้อในสหภาพยุโรปไม่ได้รับความสนใจจากตลาด

คู่สกุลเงิน EUR/USD เริ่มแสดงการเคลื่อนไหวลงอย่างอ่อนในวันอังคาร ซึ่งน่าจะเป็นผลมาจากคลื่นการแก้ไขที่ไม่รุนแรงอีกลูกหนึ่ง แม้ว่าจะมีการฝ่าระดับเส้นแนวโน้ม แต่แนวโน้มขาขึ้นโดยรวมยังคงอยู่เนื่องจากปัจจัยพื้นฐานยังคงกดดันเงินดอลลาร์สหรัฐอย่างต่อเนื่อง เมื่อวานนี้ที่ดอลลาร์แข็งขึ้นนั้นไม่ได้มีความหมายใดๆ ทั้งสิ้น วันนี้ Donald Trump อาจออกมาประกาศกำหนดภาษีใหม่ และดอลลาร์ก็อาจจะร่วงลงอีกครั้ง เมื่อวานนี้ ความสำคัญหลักในด้านข้อมูลเศรษฐกิจมหภาคคือข้อมูลเงินเฟ้อของสหภาพยุโรปและรายงาน

Paolo Greco 03:41 2025-06-04 UTC+2

GBP/USD: แผนการซื้อขายสำหรับช่วงการเทรดในสหรัฐฯ วันที่ 3 มิถุนายน (รีวิวการเทรดในช่วงเช้า)

ในคำพยากรณ์ช่วงเช้าของฉัน ฉันชี้ไปที่ระดับ 1.3517 และวางแผนที่จะใช้ระดับนี้เป็นพื้นฐานในการตัดสินใจซื้อขาย มาดูกราฟ 5 นาทีและวิเคราะห์สิ่งที่เกิดขึ้น การลดลงและการเกิด false breakout รอบๆ ระดับ 1.3517 นำไปสู่การเข้าซื้อของเงินปอนด์ ส่งผลให้คู่สกุลเงินขึ้นไปประมาณ

Miroslaw Bawulski 18:47 2025-06-03 UTC+2

EUR/USD: แผนการซื้อขายสำหรับช่วงการซื้อขายในสหรัฐอเมริกาวันที่ 3 มิถุนายน (การทบทวนการซื้อขายช่วงเช้า)

ในคำพยากรณ์ตอนเช้าของฉัน ฉันได้ชี้ระดับ 1.1404 และวางแผนที่จะตัดสินใจซื้อขายโดยยึดตามระดับนี้ ลองมาดูแผนภูมิ 5 นาทีและดูว่าเกิดอะไรขึ้น การลดลงและการเบรคที่เป็นเท็จรอบๆ ระดับ 1.1404 นำไปสู่การเข้าสู้ซื้อของยูโร แต่ดังที่คุณเห็นในแผนภูมิ คู่สกุลเงินไม่สามารถเติบโตได้อย่างมีนัยสำคัญ มุมมองทางเทคนิคสำหรับช่วงครึ่งหลังของวันยังคงไม่เปลี่ยนแปลง ข้อกำหนดสำหรับการเปิดสถานะซื้อใน

Miroslaw Bawulski 18:32 2025-06-03 UTC+2

วิธีการเทรดคู่เงิน GBP/USD ในวันที่ 3 มิถุนายน? เคล็ดลับง่ายๆ และการวิเคราะห์การเทรดสำหรับมือใหม่

คู่สกุลเงิน GBP/USD ก็มีการซื้อขายสูงขึ้นตลอดวันจันทร์เช่นกัน อย่างไรก็ตาม ภาพรวมด้านเทคนิคของเงินปอนด์อังกฤษแตกต่างเล็กน้อยจากยูโร ใช่ เงินปอนด์ก็กำลังขึ้นเช่นเดียวกับยูโร และยังมากกว่าอีกด้วย อย่างไรก็ตาม ยูโรได้ทะลุจุดสูงสุดก่อนหน้านี้ในกรอบเวลารายชั่วโมง ขณะที่เงินปอนด์ยังไม่ทำได้ ซึ่งอาจจะบ่งบอกถึงสภาพที่มีการซื้อเกินมาตรฐานในสกุลเงินอังกฤษ จำไว้ว่าการที่เส้นแนวโน้มขาขึ้นถูกทำลายลงก่อนหน้านี้นั้นเป็นสัญญาณแสดงถึงการเปลี่ยนแปลงของแนวโน้มที่อาจเกิดขึ้น แน่นอนว่าภูมิหลังทางพื้นฐานที่แข็งแกร่งสามารถพลิกสถานการณ์ทางเทคนิคได้—สิ่งที่เราได้สังเกตเห็นบ่อย

Paolo Greco 06:27 2025-06-03 UTC+2

วิธีเทรดคู่สกุลเงิน EUR/USD ในวันที่ 3 มิถุนายน? เคล็ดลับง่ายๆ และการวิเคราะห์การซื้อขายสำหรับมือใหม่

คู่ค่าเงิน EUR/USD มีการซื้อขายเพิ่มขึ้นในวันจันทร์ เราได้เตือนว่าเงินดอลลาร์มีแนวโน้มที่จะลดลงอีกครั้งหลังจากที่ทรัมป์ประกาศขึ้นภาษีนำเข้าเหล็กและอะลูมิเนียม ผลที่ตามมาคือ EUR/USD เคลื่อนไหวขึ้น ในวันจันทร์ ราคาขยับขึ้นเกือบตลอดทั้งวัน โดยเริ่มเคลื่อนไหวตั้งแต่ช่วงกลางคืน โดยแท้จริง การขึ้นภาษีครั้งนี้บ่งชี้ถึงการยกระดับสงครามการค้าอีกครั้ง เนื่องจากเงินดอลลาร์สหรัฐลดลงเพราะปัจจัยนี้มาเป็นเวลาหลายเดือนแล้ว ในขณะที่กลบความสนใจจากปัจจัยอื่น

Paolo Greco 06:27 2025-06-03 UTC+2
หากไม่สะดวกคุยในตอนนี้
ระบุคำถามไว้ได้ใน แชท.
Widget callback
 

Dear visitor,

Your IP address shows that you are currently located in the USA. If you are a resident of the United States, you are prohibited from using the services of InstaFintech Group including online trading, online transfers, deposit/withdrawal of funds, etc.

If you think you are seeing this message by mistake and your location is not the US, kindly proceed to the website. Otherwise, you must leave the website in order to comply with government restrictions.

Why does your IP address show your location as the USA?

  • - you are using a VPN provided by a hosting company based in the United States;
  • - your IP does not have proper WHOIS records;
  • - an error occurred in the WHOIS geolocation database.

Please confirm whether you are a US resident or not by clicking the relevant button below. If you choose the wrong option, being a US resident, you will not be able to open an account with InstaForex anyway.

We are sorry for any inconvenience caused by this message.