empty
01.07.2022 10:40 AM
EUR/USD analysis and forecast for July 1, 2022

As a result, the first month of trading in the summer has ended. We must acknowledge that the primary currency pair EUR/USD finished on a rather sad note. The US dollar is still strong, as demonstrated at the June auction when it faced up against all except the Swiss franc's primary rivals. However, this is entirely another tale. And I recommend looking at the most senior timeframe and summarizing the month's outcomes that ended yesterday in today's article on the euro/dollar.

Monthly

This image is no longer relevant

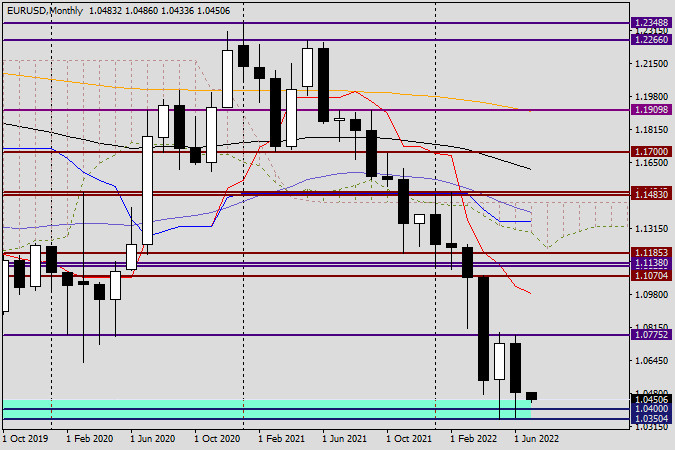
You will first notice the major support area near 1.0350, which is now indubitably historical. The fall, which had already been noticed in 2017, was stopped by this sturdy technical level, as is evident on the chart. I recall that occasion and how parity, or the level of 1.0000, was expected for the euro/dollar at that time. Instead, the pair took action, turned upward, and not only turned around but also grew decently, rising to the level of 1.2555. Following that, both ups and downs were seen in the price dynamics of the EUR/USD, and as a result of all these moves, the quote fell back to levels last seen five years ago. The relatively large shadows of the last two monthly candles amply illustrate the strength of the 1.0350 level. But nothing endures forever. Once more, I'd guess that the pair would indeed move quickly toward parity in the event of a true collapse of the 1.0350-1.0300 price range. The ending of July trading above 1.0775 will likely pave the way for higher prices, possibly even to the Tenkan red line, which is positioned at 1.0983, or to another significant historical and technical level of 1.1000. This is easy to predict, given the lows and highs of the previous month. If the July trades close at 1.0339 (the January 2017 lows), the pair will undoubtedly anticipate a route to the south, whose ferocity will only grow.

Daily

This image is no longer relevant

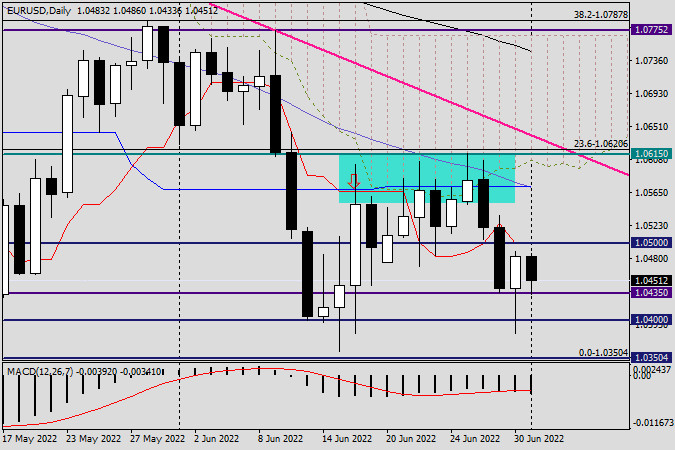
The EUR/USD pair displayed resilience throughout yesterday's trade. After attempting to breach another important key of 1.0400, it found firm support at 1.0383 and figuratively rose from the ashes to close Thursday's session at 1.0483. However, as the euro/dollar is currently trading below the red line of the Tenkan Ichimoku indicator, which is directly at this crucial level and the major psychological level of 1.0500, negative risks for the pair still exist. In this regard, it will be fascinating to see how the market will respond to today's eurozone inflation figures. I want to remind you that all versions of the eurozone consumer price index, including their base value, will be released at 10:00 London time. Since the European regulator has launched and postponed the issue of high inflation, I assume that the growth of consumer prices in the eurozone will be comparable to and, in some cases, even exceeding forecasts. This will support the single currency because it will be clearer that the ECB needs to turn its words into deeds. If technology is our only point of interest, then the bullish candle from yesterday with its lengthy lower shadow provides every reason to anticipate that the EUR/USD expansion may continue today. However, as is customary on the final trading day of the week, I won't provide any specific suggestions for trading. I assure you that this is not the ideal time.

Summary
Urgency
Analytic
Ivan Aleksandrov
Start trade
รับผลกำไรจากการเปลี่ยนแปลงอัตราสกุลเงินดิจิทัลกับ InstaForex.
ดาวน์โหลด MetaTrader 4 และเปิดการซื้อขายครั้งแรกของคุณ.
  • Grand Choice
    Contest by
    InstaForex
    InstaForex always strives to help you
    fulfill your biggest dreams.
    เข้าร่วมการแข่งขัน


บทความแนะนำ

สัญญาณการเทรดสำหรับ GOLD (XAU/USD) สำหรับวันที่ 30-31 กรกฎาคม 2025: ซื้อเหนือ $3,320 (21 SMA - 5/8 Murray)

ราคาทองคำกำลังซื้อขายรอบ 3,332 โดยฟื้นตัวหลังจากที่เคยลดลงถึงระดับสำคัญที่ $3,300 โดยคาดว่าราคาทองคำจะขยับขึ้นไปที่ระดับ 7/8 ของ Murray ใกล้เคียงกับ 3,398 ในอีกไม่กี่วันข้างหน้า ทองคำกำลังแสดงสัญญาณบวก ดังนั้นการย้อนกลับใดๆ ตราบใดที่ราคาทองคำยังคงอยู่เหนือระดับ 5/8

Dimitrios Zappas 07:08 2025-07-30 UTC+2

สัญญาณการซื้อขายสำหรับ EUR/USD วันที่ 30-31 กรกฎาคม 2025: ซื้อเหนือ 1.1530 (การดีดตัวกลับ - 6/8 Murray)

ในช่วงต้นของการซื้อขายในยุโรป ยูโรอยู่ที่ประมาณ 1.1564 ที่กำลังฟื้นตัวหลังจากลงไปแตะระดับต่ำสุดที่ประมาณ 1.1518 ระดับนี้ทำหน้าที่เป็นแนวรับที่ดีสำหรับยูโร ตั้งแต่นั้นมาเราจะเห็นการฟื้นตัว ซึ่งมีแนวโน้มที่จะเพิ่มขึ้นในอีกไม่กี่ชั่วโมงข้างหน้าเพื่อไปยัง 21SMA หรือ 200EMA ถ้ายูโรฟื้นตัวรอบ 1.1518 หรือหากแรงกดดันขาลงยังคงดำเนินไป มันอาจพบแนวรับแข็งแกร่งรอบเส้นมอร์เรย์

Dimitrios Zappas 07:07 2025-07-30 UTC+2

สัญญาณการซื้อขายสำหรับ BITCOIN สำหรับวันที่ 30-31 กรกฎาคม 2025: ขายต่ำกว่า $118,750 (6/8 มิวเรย์ - 21 SMA)

Bitcoin กำลังซื้อขายอยู่ที่ประมาณ 117,547 ต่ำกว่าระดับ 6/8 ของ Murray ต่ำกว่าค่าเฉลี่ยเคลื่อนที่ระยะสั้น 21 วัน (SMA) และอยู่ภายในช่องแนวโน้มขาลงที่เกิดขึ้นเมื่อวันที่ 12 กรกฎาคม Bitcoin

Dimitrios Zappas 07:05 2025-07-30 UTC+2

แม้ว่าจะมีศักยภาพในการปรับฐานจำกัด USD/CHF ยังคงมีแนวโน้มขาขึ้นในภาพรวม ในวันพุธที่ 30 กรกฎาคม 2025

USD/CHF – วันพุธที่ 30 กรกฎาคม 2025 การปรากฏของการแตกต่างระหว่างการเคลื่อนไหวของราคา USD/CHF กับตัวบ่งชี้ RSI(14) บ่งชี้ถึงศักยภาพในการปรับตัวที่จำกัด แม้ว่า RSI(14) จะเป็นกลาง-ขาลง แต่แนวโน้มโดยรวมของ

Arief Makmur 06:50 2025-07-30 UTC+2

ผู้ขายที่ครองตลาดใน AUD/USD สามารถทำลายระดับจุดหมุนในวันนี้ วันพุธที่ 30 กรกฎาคม 2025 ได้หรือไม่?

AUD/USD – วันพุธที่ 30 กรกฎาคม 2025 แม้ว่าเงื่อนไข RSI (14) จะอยู่ในพื้นที่เป็นกลางอ่อนถึงขาขึ้น แต่ EMA (50) อยู่ต่ำกว่า

Arief Makmur 06:50 2025-07-30 UTC+2

การพยากรณ์ EUR/USD สำหรับวันที่ 30 กรกฎาคม 2025

เมื่อวันอังคารที่ผ่านมา ยูโรลดลง 42 pips การเคลื่อนไหวที่ลดลงหยุดลงที่ค่าเฉลี่ย 55 วัน (MA55) ขณะนี้การทดสอบแนวรับเป้าหมายที่ 1.1495 — หากตลาดตัดสินใจตอบสนองต่อคำแนะนำจาก FOMC — อาจเกิดขึ้นผ่านการเบรกเอาท์อย่างรวดเร็ว

Laurie Bailey 05:13 2025-07-30 UTC+2

การคาดการณ์ GBP/USD สำหรับวันที่ 30 กรกฎาคม 2025

เมื่อสิ้นสุดวันเมื่อวาน ค่าเงินปอนด์อังกฤษได้เข้าสู่ระดับต่ำกว่า 1.3369 แต่ลองมาดูที่กราฟรายสัปดาห์กันหน่อยครับ — ราคาได้ทดสอบแนวรับที่เส้น MACD: หากราคาหลุดลงต่ำกว่าระดับนี้ จะเปิดทางไปสู่เป้าหมายที่ 1.3040 — เส้นค่าเฉลี่ยฝังตัวในช่องราคาทั่วโลก ซึ่งตรงกับระดับแนวต้านจากเดือนกรกฎาคมและพฤศจิกายน 2024 (ตามเครื่องหมายถูก)

Laurie Bailey 05:13 2025-07-30 UTC+2

การคาดการณ์น้ำมันสำหรับวันที่ 30 กรกฎาคม 2025

น้ำมัน (CL) เช้านี้ ราคาน้ำมันได้มาถึงระดับเป้าหมายที่ 69.43 และเส้น MACD ในกรอบรายสัปดาห์แล้ว เมื่อสองสัปดาห์ก่อน เกิดการดึงกลับที่กินเวลาสองสัปดาห์จากระดับแนวต้านเหล่านี้ (ดูตรงลูกศร) แต่สถานการณ์ปัจจุบันแตกต่างไปเล็กน้อย — เส้นสัญญาณของออสซิลเลเตอร์ Marlin

Laurie Bailey 05:13 2025-07-30 UTC+2

EUR/USD – วันที่ 29 กรกฎาคม การวิเคราะห์ Smart Money System

เรายังคงสังเกตเห็นแนวโน้มขาขึ้นที่แข็งแกร่ง ซึ่งยังไม่มีสัญญาณที่บ่งบอกว่าจะสิ้นสุดในเร็วๆ นี้ ทั้งนี้ยังไม่มีเหตุผลใดที่ทำให้สามารถพิจารณาว่ามันสิ้นสุดแล้ว ฉันเข้าใจว่าการลงนามข้อตกลงการค้าระหว่าง EU และ U.S. ซึ่งเห็นชัดว่ามีประโยชน์ต่อ U.S. มากกว่า เป็นข้อโต้แย้งสำคัญที่สนับสนุนเงินดอลลาร์ที่แข็งแกร่งยิ่งขึ้น และจริง ๆ แล้ว

Samir Klishi 18:48 2025-07-29 UTC+2

EUR/JPY – การวิเคราะห์, การคาดการณ์, และสถานการณ์ตลาดในปัจจุบัน

ค่าเงินยูโรกำลังแสดงให้เห็นถึงการแสดงที่ค่อนข้างอ่อนแอ เนื่องจากความกังวลเกี่ยวกับข้อตกลงการค้าที่อาจจะไม่มีความสมดุลระหว่างสหรัฐอเมริกาและสหภาพยุโรป นอกจากนี้ ตลาดยังคงระมัดระวังอยู่ก่อนที่จะเกิดเหตุการณ์สำคัญที่เกี่ยวข้องกับการตัดสินใจของธนาคารกลางที่มีกำหนดจะเกิดขึ้นในสัปดาห์นี้ ปัจจัยเหล่านี้สนับสนุนค่าเงินเยนญี่ปุ่นซึ่งถือว่าเป็นค่าเงินที่มีความมั่นคง และกำลังสร้างแรงกดดันบางอย่างต่อคู่เงิน EUR/JPY ซึ่งมีส่วนทำให้ราคาลดลง จากมุมมองทางเทคนิค บนแผนภูมิ 4 ชั่วโมง ราคาปัจจุบันได้เคลื่อนต่ำกว่าและประคับประคองตัวอยู่ใต้ค่าเฉลี่ยเคลื่อนที่ที่เรียบง่าย (SMA)

Irina Yanina 17:54 2025-07-29 UTC+2
หากไม่สะดวกคุยในตอนนี้
ระบุคำถามไว้ได้ใน แชท.
Widget callback
 

Dear visitor,

Your IP address shows that you are currently located in the USA. If you are a resident of the United States, you are prohibited from using the services of InstaFintech Group including online trading, online transfers, deposit/withdrawal of funds, etc.

If you think you are seeing this message by mistake and your location is not the US, kindly proceed to the website. Otherwise, you must leave the website in order to comply with government restrictions.

Why does your IP address show your location as the USA?

  • - you are using a VPN provided by a hosting company based in the United States;
  • - your IP does not have proper WHOIS records;
  • - an error occurred in the WHOIS geolocation database.

Please confirm whether you are a US resident or not by clicking the relevant button below. If you choose the wrong option, being a US resident, you will not be able to open an account with InstaForex anyway.

We are sorry for any inconvenience caused by this message.