empty
02.10.2023 10:39 AM
Weekly forecast based on simplified wave analysis for EUR/USD, USD/JPY, GBP/JPY, USD/CAD, EUR/CHF, and gold from October 2nd

EUR/USD

Analysis:

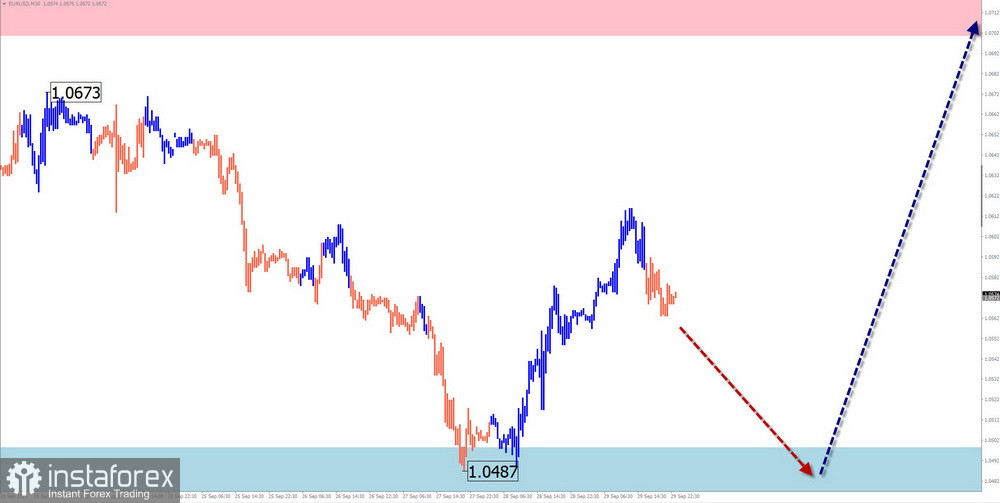
Quotes of the European currency continue to move in a descending trend. Currently, the price is trading within a range between intermediate support and strong resistance, which was breached downward two weeks ago. Since September 27th, an upward corrective zigzag has been forming. Its structure was not completed at the time of analysis.

Forecast:

In the upcoming week, the completion of the current downward trend of the euro exchange rate is expected in the area of calculated support, followed by a reversal. By the end of the week, we can expect a resumption of the price uptrend with an increase in the exchange rate towards the calculated resistance zone.

This image is no longer relevant

Potential Reversal Zones

Resistance:

  • 1.0700/1.0750

Support:

  • 1.0500/1.0450

Recommendations:

Sales: Selling before the completion of the upcoming price uptrend may carry risks.

Purchases: Purchases will become possible with fractional lots after confirmation signals of a reversal appear in the support zone.

USD/JPY

Analysis:

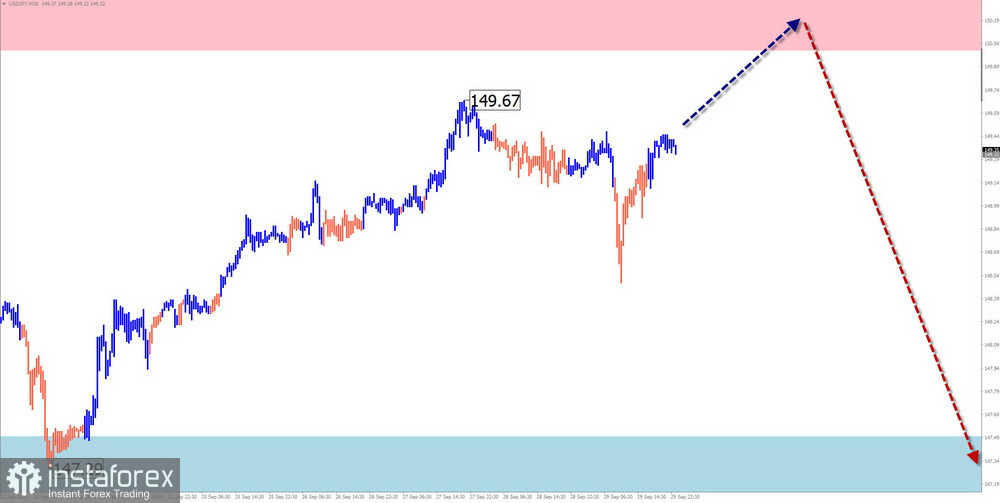
The exchange rate of the Japanese yen against the US dollar continues to weaken in the major markets. The yen's rate is approaching record levels again. However, the structure of the current wave does not show completion. The current, unfinished wave segment dates back to July 14th. The lower boundary of the preliminary target zone for the entire current wave passes through the calculated resistance area.

Forecast:

At the beginning of the upcoming week, we can expect a continuation of the upward price movement, with an increase in the price towards the resistance levels. After that, a reversal and price decline are expected. The highest volatility is likely to occur after the release of news data.

This image is no longer relevant

Potential Reversal Zones

Resistance:

  • 150.00/150.50

Support:

  • 147.50/147.00

Recommendations:

Sales: Conditions for such deals in the pair's market will arise after reversal signals appear in the resistance zone on your trading system.

Purchases: Purchases have limited potential and may result in losses.

GBP/JPY

Analysis:

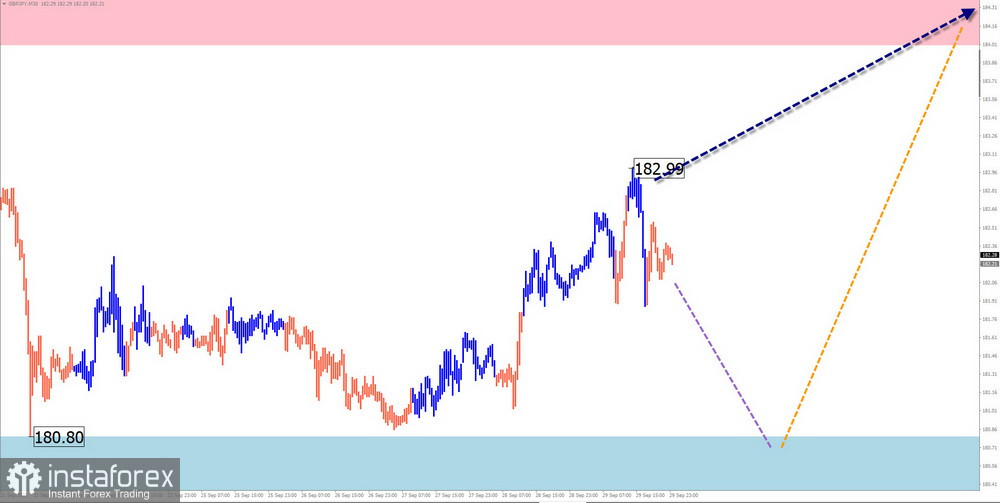
Over the past two years, an upward wave has set the trend direction of the British pound relative to the Japanese yen. In the short term, the unfinished wave in the main trend has been moving since late July. The structure of this wave is nearing completion in its middle part (B), but it is not yet completed at the time of analysis.

Forecast:

In the coming days, we can expect a continuation of the downward movement with a decrease in the price towards the calculated support area. In the second half of the week, conditions for a change in direction and a resumption of the price uptrend are likely to form. The resistance zone represents the upper boundary of the possible weekly range of the pair.

This image is no longer relevant

Potential Reversal Zones

Resistance:

  • 184.00/184.50

Support:

  • 180.80/180.30

Recommendations:

Sales: Sales will be possible with fractional lots during individual sessions with reduced volume. It is essential to consider the limited potential for decline.

Purchases: Transactions are not relevant until confirmed reversal signals appear on your trading system.

USD/CAD

Analysis:

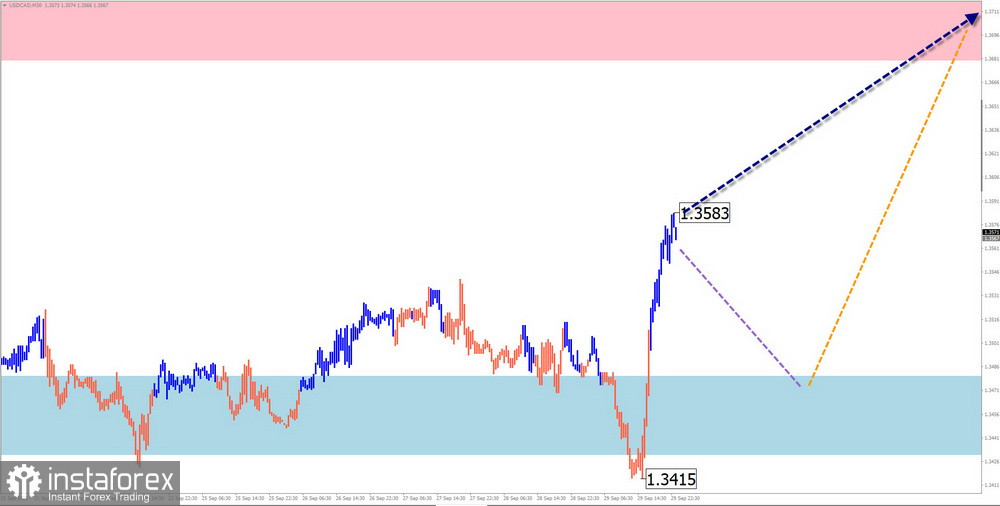
The analysis of the weekly chart of the Canadian dollar shows the formation of an ascending wave zigzag since mid-July of this year. Price fluctuations over the last month and a half have formed the middle part (B). Since September 19th, an upward wave zigzag with reversal potential has been developing.

Forecast:

In the first days of the upcoming week, a general sideways price movement is likely, initially declining towards the boundaries of the calculated support. The second half of the week is expected to be more volatile. We can anticipate increased activity and a resumption of the pair's price uptrend.

This image is no longer relevant

Potential Reversal Zones

Resistance:

  • 1.3680/1.3730

Support:

  • 1.3480/1.3430

Recommendations:

Sales: In the coming days, conditions for such transactions in the pair's market will not be present.

Purchases: Recommended for trading after corresponding signals appear in the support zone.
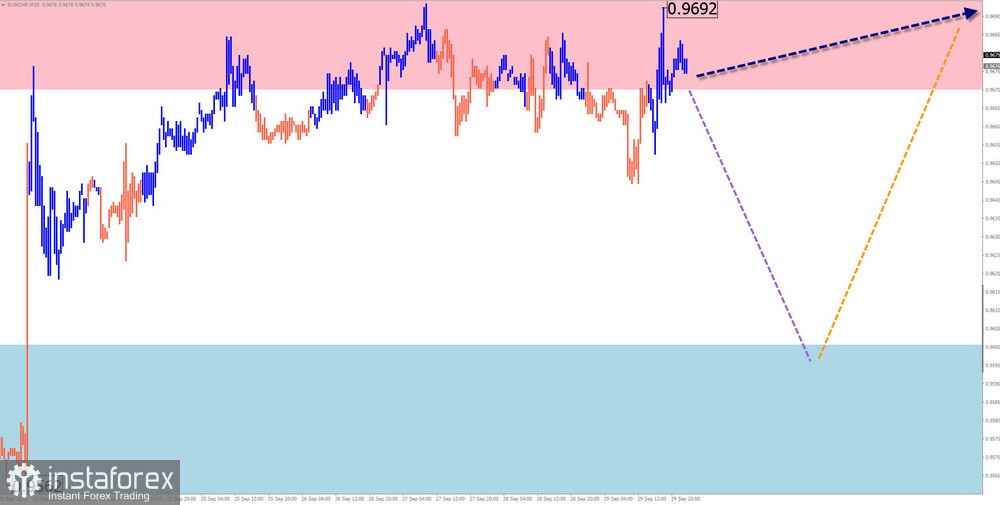
EUR/CHF

Analysis:

The trend direction of the EUR/CHF currency pair since the beginning of the current year has been a descending trend. The price has reached the support zone of a larger senior time frame. Since September 15th, an upward corrective movement has been forming, which is not yet completed at the time of analysis.

Forecast:

At the beginning of the week, there is a high probability of a flat price movement with a downward vector. A price decrease can be expected up to the support zone. On this stretch, we can anticipate a reversal formation and a resumption of the pair's price uptrend.

This image is no longer relevant

Potential Reversal Zones

Resistance:

  • 0.9770/0.9820

Support:

  • 0.9600/0.9550

Recommendations:

Purchases: Will become relevant after corresponding signals from your trading system appear in the support zone.

Sales: Possible during separate sessions with fractional lots. The potential for decline is limited by support.
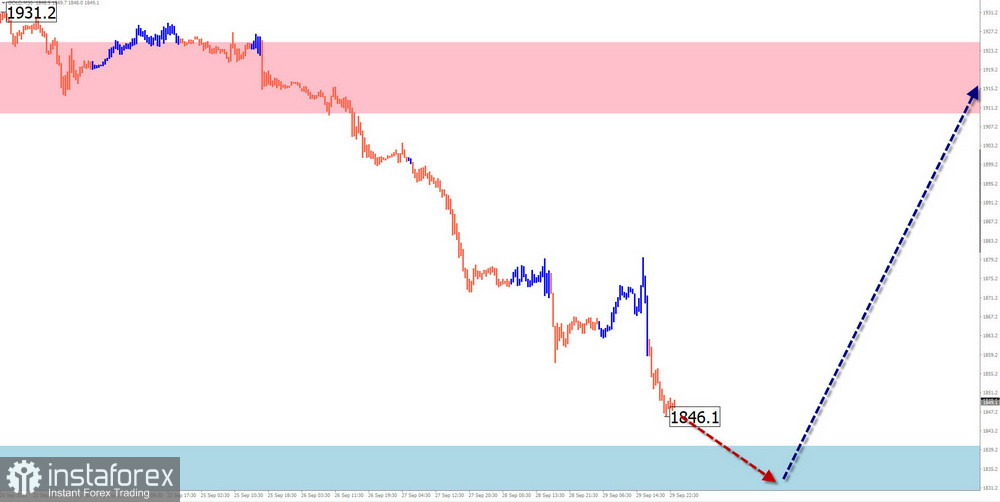
GOLD

Analysis:

On the gold chart, the primary price direction since March of this year has been a descending wave algorithm. On a larger time frame, this section of the chart forms a corrective wave in the form of a shifting plane. Analysis of the structure shows its incompleteness at the time of analysis.

Forecast:

At the beginning of the upcoming week, the completion of the price pullback is expected. Then, we can count on the formation of a reversal in the support zone and a resumption of the pair's price uptrend up to the boundaries of the calculated resistance.

This image is no longer relevant

Potential Reversal Zones

Resistance:

  • 1910.0/1925.0

Support:

  • 1840.0/1825.0

Recommendations:

Sales: Due to the limited potential, high-risk sales may lead to losses.

Purchases: After your trading system confirms that signals appear in the support zone, you can use them.

Explanations: In simplified wave analysis (SWA), all waves consist of three parts (A, B, and C). In each time frame, the latest unfinished wave is analyzed. Dashed lines indicate expected movements.

Attention: The wave algorithm does not consider the duration of instrument movements over time!

เลือกช่วงเวลา
5
นาที
15
นาที
30
นาที
1
ชั่วโมง
4
ชั่วโมง
1
วัน
1
สัปดาห์
รับผลกำไรจากการเปลี่ยนแปลงอัตราสกุลเงินดิจิทัลกับ InstaForex.
ดาวน์โหลด MetaTrader 4 และเปิดการซื้อขายครั้งแรกของคุณ.
  • Grand Choice
    Contest by
    InstaForex
    InstaForex always strives to help you
    fulfill your biggest dreams.
    เข้าร่วมการแข่งขัน


บทความแนะนำ

การวิเคราะห์ EUR/USD ประจำวันที่ 11 มิถุนายน 2025

โครงสร้างของคลื่นในกราฟ 4 ชั่วโมงสำหรับคู่เงิน EUR/USD ได้เปลี่ยนเป็นการก่อตัวที่มีแนวโน้มเพิ่มขึ้นอย่างแข็งแกร่งและยังคงรักษารูปแบบนี้ไว้ ผมเชื่อว่าไม่มีข้อสงสัยว่านี่เป็นผลมาจากการเปลี่ยนแปลงนโยบายการค้าของสหรัฐฯ อย่างแน่นอน จนถึงวันที่ 28 กุมภาพันธ์ เมื่อค่าเงินดอลลาร์สหรัฐฯ เริ่มอ่อนค่าลงอย่างมาก โครงสร้างของคลื่นได้บ่งชี้ถึงแนวโน้มขาลงอย่างชัดเจน โดยคลื่นแก้ไขที่

Chin Zhao 19:00 2025-06-11 UTC+2

วิเคราะห์ GBP/USD วันที่ 11 มิถุนายน 2025

โครงสร้างคลื่นของ GBP/USD ยังคงบ่งบอกถึงการก่อตัวของรูปแบบคลื่นขาขึ้น รูปภาพของคลื่นนี้เกือบจะเหมือนกันกับคลื่นของ EUR/USD จนถึงวันที่ 28 กุมภาพันธ์ เราสังเกตเห็นการก่อตัวของโครงสร้างปรับฐานที่ชัดเจนซึ่งไม่มีข้อสงสัยใด ๆ อย่างไรก็ตาม ความต้องการในเงินดอลลาร์สหรัฐฯ เริ่มลดลงอย่างรวดเร็วในเวลาต่อมา ท้ายที่สุดนำไปสู่การกลับตัวของเทรนด์ คลื่น

Chin Zhao 18:51 2025-06-11 UTC+2

การวิเคราะห์ GBP/USD วันที่ 9 มิถุนายน 2025

สำหรับคู่สกุลเงิน GBP/USD รูปแบบคลื่นยังคงบ่งบอกถึงการก่อตัวของโครงสร้างคลื่นแรงกระตุ้นที่ขึ้นไปด้านบน รูปแบบคลื่นนี้คล้ายคลึงกับคู่สกุลเงิน EUR/USD จนถึงวันที่ 28 กุมภาพันธ์ เราได้เห็นโครงสร้างการแก้ไขที่น่าเชื่อถือที่ไม่มีข้อสงสัยใด ๆ เกิดขึ้น อย่างไรก็ตาม มีการลดลงของความต้องการในเงินดอลลาร์สหรัฐอย่างรวดเร็ว นำไปสู่การกลับทิศทางของแนวโน้มเป็นทิศทางขึ้น คลื่นที่

Chin Zhao 20:16 2025-06-09 UTC+2

วิเคราะห์ EUR/USD วันที่ 9 มิถุนายน 2025

โครงสร้างคลื่นบนกราฟ EUR/USD แบบ 4 ชั่วโมงได้เปลี่ยนไปเป็นรูปแบบขาขึ้นและยังคงรักษาโครงสร้างนี้อยู่ ฉันเชื่อว่ามีข้อสงสัยน้อยมากว่าการเปลี่ยนแปลงนี้เกิดขึ้นจากนโยบายการค้าของสหรัฐฯ รูปแบบคลื่นในตอนนี้แสดงให้เห็นถึงแนวโน้มขาลงที่ชัดเจนเกิดขึ้นช่วงวันที่ 28 กุมภาพันธ์เมื่อเงินดอลลาร์สหรัฐฯเริ่มลดลงอย่างรวดเร็ว มีการสร้างคลื่นแก้ไขที่ 2 ขึ้นมา อย่างไรก็ตาม การประกาศอัตราภาษีจาก Trump

Chin Zhao 20:09 2025-06-09 UTC+2

การวิเคราะห์ EUR/USD ประจำวันที่ 5 มิถุนายน 2025

รูปแบบคลื่นในกราฟ 4 ชั่วโมงของคู่สกุลเงิน EUR/USD ได้เปลี่ยนแปลงเป็นโครงสร้างที่เป็นขาขึ้นและยังคงรักษารูปแบบนี้เอาไว้ ฉันเชื่อว่ามีความสงสัยเล็กน้อยว่าการเปลี่ยนแปลงนี้เกิดขึ้นเนื่องจากนโยบายการค้าใหม่ของสหรัฐฯ เพียงอย่างเดียว จนถึงวันที่ 28 กุมภาพันธ์ เมื่อตอนที่ค่าเงินดอลลาร์สหรัฐเริ่มร่วงลงอย่างรวดเร็ว ทั้งรูปแบบคลื่นทั้งหมดก็ยังคงดูเหมือนแนวโน้มขาลงที่น่าเชื่อถือ โดยมีคลื่นปรับแก้ 2 กำลังก่อตัวขึ้น

Chin Zhao 20:03 2025-06-05 UTC+2

การวิเคราะห์ GBP/USD ณ วันที่ 4 มิถุนายน 2025

รูปแบบคลื่นสำหรับ GBP/USD ยังคงบ่งบอกถึงการก่อตัวของโครงสร้างคลื่นที่มีแรงผลักดันขึ้น รูปแบบคลื่นมีความเหมือนกับการระบายที่เกิดขึ้นกับคู่เงิน EUR/USD จนถึงวันที่ 28 กุมภาพันธ์ เราสังเกตเห็นการก่อตัวของโครงสร้างการแก้ไขที่มีความชัดเจน และไม่มีข้อสงสัยใดๆ อย่างไรก็ตาม หลังจากนั้น ความต้องการสำหรับสกุลเงินดอลลาร์สหรัฐเริ่มลดลงอย่างรวดเร็ว ส่งผลให้เกิดการกลับตัวของแนวโน้มเป็นขาขึ้น คลื่นลูกที่

Chin Zhao 18:48 2025-06-04 UTC+2

การวิเคราะห์ EUR/USD ประจำวันที่ 3 มิถุนายน 2025

รูปแบบคลื่นในกราฟ 4 ชั่วโมงสำหรับ EUR/USD ได้เปลี่ยนแปลงไปเป็นโครงสร้างขาขึ้น และยังคงเป็นเช่นนั้นอยู่ ผมเชื่อว่าไม่มีข้อสงสัยเลยว่าการเปลี่ยนแปลงนี้เกิดขึ้นมาโดยเฉพาะเนื่องจากนโยบายการค้าของสหรัฐฯ ใหม่ จนถึงวันที่ 28 กุมภาพันธ์ เมื่อการลดลงของดอลลาร์สหรัฐฯ เริ่มกลับตัว รูปแบบคลื่นดูเหมือนจะเป็นส่วนหนึ่งของเทรนด์ขาลงที่น่าเชื่อถือ โดยมีคลื่นปรับฐานที่

Chin Zhao 19:38 2025-06-03 UTC+2

การวิเคราะห์ GBP/USD วันที่ 3 มิถุนายน 2025

โครงสร้างคลื่นสำหรับคู่ GBP/USD ยังคงบ่งชี้ถึงการพัฒนาของรูปแบบคลื่นที่ก้าวไปในทิศทางขึ้น การเกิดขึ้นของรูปแบบคลื่นนี้คล้ายคลึงกับคู่ EUR/USD จนกระทั่งถึงวันที่ 28 กุมภาพันธ์ เราสังเกตเห็นการเกิดโครงสร้างการปรับตัวที่น่าเชื่อถือ ซึ่งไม่ทิ้งพื้นที่ให้สงสัย อย่างไรก็ตาม ความต้องการเงินดอลล่าร์สหรัฐเริ่มลดลงอย่างรวดเร็วจนกระทั่งเกิดการพลิกผันไปในทางขึ้น คลื่น 2 ของแนวโน้มนี้มีรูปคลื่นเพียงคลื่นเดียว

Chin Zhao 19:32 2025-06-03 UTC+2

วิเคราะห์ EUR/USD ประจำวันที่ 2 มิถุนายน 2025

โครงสร้างคลื่นบนชาร์ต 4 ชั่วโมงสำหรับ EUR/USD ได้เปลี่ยนเป็นรูปแบบขาขึ้นและยังคงรักษารูปแบบนี้ไว้ ฉันเชื่อว่าไม่มีข้อสงสัยว่า การเปลี่ยนแปลงนี้เกิดขึ้นเพียงเพราะนโยบายการค้าของสหรัฐฯ ใหม่เท่านั้น ก่อนวันที่ 28 กุมภาพันธ์ ซึ่งเป็นช่วงที่ค่าเงินดอลลาร์สหรัฐเริ่มลดลงอย่างมาก โครงสร้างคลื่นปรากฏเป็นสองช่วงแนวโน้มขาลงที่น่าเชื่อถือ กำลังมีการสร้างคลื่นที่แก้ไขที่

Chin Zhao 19:07 2025-06-02 UTC+2

การวิเคราะห์ GBP/USD วันที่ 2 มิถุนายน 2025

โครงสร้างคลื่นของ GBP/USD ยังคงแสดงถึงการก่อตัวของรูปแบบคลื่นแรงกระตุ้นขาขึ้น โครงสร้างของคลื่นมีความใกล้เคียงกับของ EUR/USD จนถึงวันที่ 28 กุมภาพันธ์ เราสังเกตเห็นรูปแบบโครงสร้างที่มีความน่าเชื่อถือ โดยไม่มีข้อสงสัยแต่อย่างใด อย่างไรก็ตาม ความต้องการดอลลาร์สหรัฐจากนั้นเริ่มลดลงอย่างรวดเร็ว ส่งผลให้เกิดการกลับตัวของแนวโน้ม คลื่นที่

Chin Zhao 19:05 2025-06-02 UTC+2
หากไม่สะดวกคุยในตอนนี้
ระบุคำถามไว้ได้ใน แชท.
Widget callback
 

Dear visitor,

Your IP address shows that you are currently located in the USA. If you are a resident of the United States, you are prohibited from using the services of InstaFintech Group including online trading, online transfers, deposit/withdrawal of funds, etc.

If you think you are seeing this message by mistake and your location is not the US, kindly proceed to the website. Otherwise, you must leave the website in order to comply with government restrictions.

Why does your IP address show your location as the USA?

  • - you are using a VPN provided by a hosting company based in the United States;
  • - your IP does not have proper WHOIS records;
  • - an error occurred in the WHOIS geolocation database.

Please confirm whether you are a US resident or not by clicking the relevant button below. If you choose the wrong option, being a US resident, you will not be able to open an account with InstaForex anyway.

We are sorry for any inconvenience caused by this message.