empty
06.08.2022 03:24 PM
EUR/USD analysis on August 5. American statistics did everything they could to help the dollar.

This image is no longer relevant

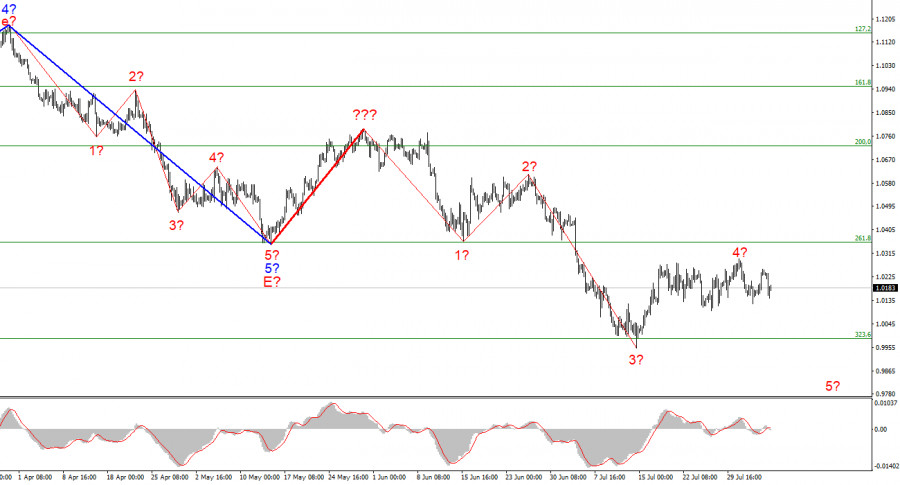
The wave marking of the 4-hour chart for the euro/dollar instrument does not require new adjustments. I recently built a new wave markup that does not yet consider the rising wave marked with a bold red line. The whole wave structure can be complicated an unlimited number of times. It is the disadvantage of wave analysis since any structure can always take a more complex and extended form. Therefore, now I propose to work on simpler wave structures that contain waves of a lower scale.

As you can see, the construction of a descending wave has presumably begun, which may be wave 5 of a new downward trend section. If this assumption is correct, the instrument will continue to decline with targets below 1.0000. The supposed wave 4 took a three-wave form and surprisingly coincided with the peak of the supposed wave 4, according to the British. Thus, perhaps this is the moment the market has been waiting for. The euro and the pound are now coinciding in their wave markings, suggesting a new decline. The wave pattern may still take a more complex form, which we would like to avoid, but the wave pattern looks very convincing at the moment.

Payrolls and unemployment turned out to be very strong.

The euro/dollar instrument declined by 60 basis points on Thursday. The market traded the instrument very calmly for most of the day, but in the afternoon, three important reports were released in America at once, and all three turned out to be strong enough for the demand for the American currency to begin to increase again. I would even say more: there were only three reports, and there were four reasons for the market to buy the dollar. It turned out that the Nonfarm Payrolls report was much better than expected (250 thousand), and its value in July was 528 thousand. However, the previous value for June was revised from 372 thousand to 398 thousand. Thus, one report, but its two values turned out to be better than what the market was waiting for. And then, two more reports came out, which also impressed the market.

From the unemployment rate, even the biggest optimists hardly expected that it would continue to decline. It is at the lowest value in half a century at 3.6%. It was until July, as yesterday it became known about its decline to 3.5%. At the same time, wages increased by 0.5% monthly with expectations of +0.3% m/m. Thus, all three reports turned out to be strong, and I am a little surprised that the US currency rose so weakly on Friday. The passivity of the market in recent weeks may play a role here. Although the peak of wave 4 has been detected, and it seems that the wave marking does not require adjustments, we have observed more horizontal movement in the last few weeks. So far, three waves are being viewed inside wave 4, and the first and second of five are being viewed inside the proposed wave 5. But for the current wave markup to be maintained, a new increase in demand for the US currency is needed. If not, then the current structure may be broken.

General conclusions.

Based on the analysis, I conclude that the construction of the downward trend section continues. If so, it is now possible to sell the instrument with targets located near the estimated 0.9397 mark, which is equivalent to 423.6% Fibonacci, for each MACD signal "down" in the calculation of the construction of wave 5. Wave 4 can be completed.

This image is no longer relevant

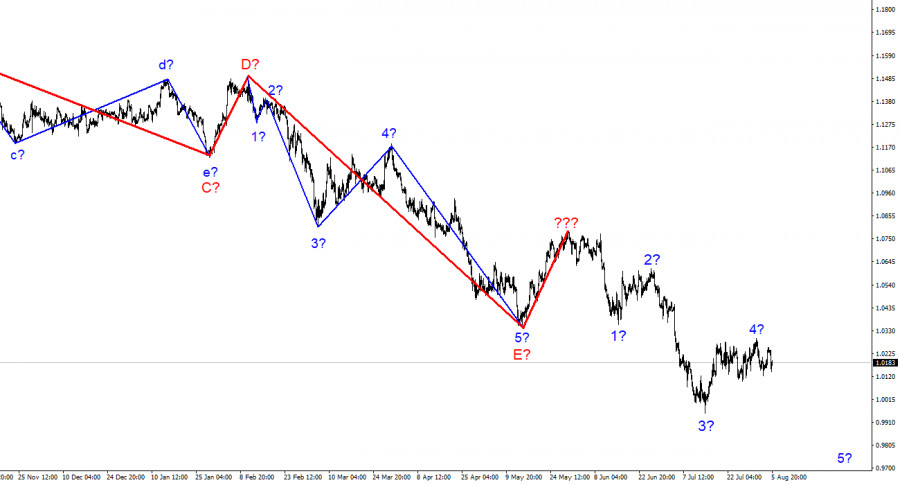
At the higher wave scale, the wave marking of the descending trend segment becomes noticeably more complicated and lengthens. It can take on almost any length, so I think it's best to isolate three and five-wave standard wave structures and work on them.

Chin Zhao,
Chuyên gia phân tích của InstaForex
© 2007-2025
Chọn khung thời gian
5
phút
15
phút
30
phút
1
giờ
4
ngày
1
ngày
1
tuần
Kiếm lợi nhuận từ những biến đổi giá của tiền điện tử với InstaForex.
Tải MetaTrader 4 và mở giao dịch đầu tiên của bạn.
  • Grand Choice
    Contest by
    InstaForex
    InstaForex always strives to help you
    fulfill your biggest dreams.
    THAM GIA CUỘC THI

Các bài báo được đề xuất

Phân tích EUR/USD ngày 11 tháng 6, 2025

Cấu trúc sóng trên biểu đồ 4 giờ cho EUR/USD đã chuyển sang một hình thức tăng giá và tiếp tục giữ hình dạng này. Tôi tin rằng không

Chin Zhao 19:00 2025-06-11 UTC+2

Phân tích GBP/USD ngày 11 tháng 6 năm 2025

Cấu trúc sóng cho GBP/USD tiếp tục gợi ý hình thành một mẫu sóng thúc đẩy tăng giá. Hình ảnh sóng gần như tương tự với EUR/USD. Cho đến ngày

Chin Zhao 18:51 2025-06-11 UTC+2

Phân tích GBP/USD ngày 9 tháng 6 năm 2025

Đối với cặp tiền GBP/USD, mô hình sóng tiếp tục cho thấy sự hình thành của một cấu trúc sóng xung lực đi lên. Mô hình sóng này khá giống

Chin Zhao 20:16 2025-06-09 UTC+2

Phân Tích EUR/USD Ngày 9 Tháng 6, 2025

Cấu trúc sóng trên biểu đồ EUR/USD 4 giờ đã chuyển sang cấu trúc tăng giá và tiếp tục duy trì cấu trúc này. Tôi tin rằng không có nhiều

Chin Zhao 20:09 2025-06-09 UTC+2

Phân tích EUR/USD ngày 5 tháng 6, 2025

Mẫu hình sóng trên biểu đồ 4 giờ của cặp EUR/USD đã chuyển thành cấu trúc đi lên và tiếp tục duy trì cấu trúc này. Tôi tin rằng

Chin Zhao 20:03 2025-06-05 UTC+2

Phân Tích GBP/USD Ngày 4 Tháng 6, 2025

Mô hình sóng cho GBP/USD tiếp tục cho thấy sự hình thành của một cấu trúc sóng xung lực đi lên. Hình ảnh sóng gần như giống

Chin Zhao 18:48 2025-06-04 UTC+2

Phân Tích EUR/USD Ngày 3 Tháng 6, 2025

Mô hình sóng trên biểu đồ 4 giờ của EUR/USD đã chuyển sang cấu trúc tăng giá và vẫn duy trì như vậy. Tôi tin rằng không có nghi

Chin Zhao 19:38 2025-06-03 UTC+2

Phân Tích GBP/USD Ngày 3 Tháng 6, 2025

Cấu trúc sóng cho cặp GBP/USD tiếp tục chỉ ra sự phát triển của mô hình sóng xung lượng tăng. Mô hình sóng này gần như giống

Chin Zhao 19:32 2025-06-03 UTC+2

Phân Tích EUR/USD Ngày 2 Tháng 6, 2025

Cấu trúc sóng trên biểu đồ 4 giờ đối với EUR/USD đã chuyển đổi thành một cấu trúc tăng giá và tiếp tục giữ nguyên hình dạng

Chin Zhao 19:07 2025-06-02 UTC+2

Phân Tích GBP/USD Ngày 2 Tháng 6, 2025

Cấu trúc sóng cho GBP/USD tiếp tục chỉ ra sự hình thành của một mô hình sóng xung tăng giá. Mô hình sóng này tương tự như mô hình

Chin Zhao 19:05 2025-06-02 UTC+2
Không thể nói chuyện ngay bây giờ?
Đặt câu hỏi của bạn trong phần trò chuyện.
Widget callback
 

Dear visitor,

Your IP address shows that you are currently located in the USA. If you are a resident of the United States, you are prohibited from using the services of InstaFintech Group including online trading, online transfers, deposit/withdrawal of funds, etc.

If you think you are seeing this message by mistake and your location is not the US, kindly proceed to the website. Otherwise, you must leave the website in order to comply with government restrictions.

Why does your IP address show your location as the USA?

  • - you are using a VPN provided by a hosting company based in the United States;
  • - your IP does not have proper WHOIS records;
  • - an error occurred in the WHOIS geolocation database.

Please confirm whether you are a US resident or not by clicking the relevant button below. If you choose the wrong option, being a US resident, you will not be able to open an account with InstaForex anyway.

We are sorry for any inconvenience caused by this message.