empty
06.08.2022 03:24 PM
EUR/USD analysis on August 5. American statistics did everything they could to help the dollar.

This image is no longer relevant

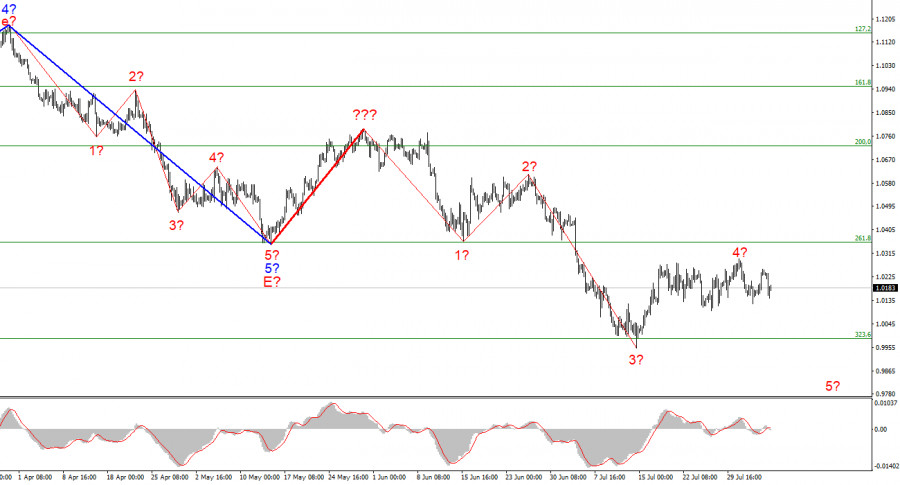
The wave marking of the 4-hour chart for the euro/dollar instrument does not require new adjustments. I recently built a new wave markup that does not yet consider the rising wave marked with a bold red line. The whole wave structure can be complicated an unlimited number of times. It is the disadvantage of wave analysis since any structure can always take a more complex and extended form. Therefore, now I propose to work on simpler wave structures that contain waves of a lower scale.

As you can see, the construction of a descending wave has presumably begun, which may be wave 5 of a new downward trend section. If this assumption is correct, the instrument will continue to decline with targets below 1.0000. The supposed wave 4 took a three-wave form and surprisingly coincided with the peak of the supposed wave 4, according to the British. Thus, perhaps this is the moment the market has been waiting for. The euro and the pound are now coinciding in their wave markings, suggesting a new decline. The wave pattern may still take a more complex form, which we would like to avoid, but the wave pattern looks very convincing at the moment.

Payrolls and unemployment turned out to be very strong.

The euro/dollar instrument declined by 60 basis points on Thursday. The market traded the instrument very calmly for most of the day, but in the afternoon, three important reports were released in America at once, and all three turned out to be strong enough for the demand for the American currency to begin to increase again. I would even say more: there were only three reports, and there were four reasons for the market to buy the dollar. It turned out that the Nonfarm Payrolls report was much better than expected (250 thousand), and its value in July was 528 thousand. However, the previous value for June was revised from 372 thousand to 398 thousand. Thus, one report, but its two values turned out to be better than what the market was waiting for. And then, two more reports came out, which also impressed the market.

From the unemployment rate, even the biggest optimists hardly expected that it would continue to decline. It is at the lowest value in half a century at 3.6%. It was until July, as yesterday it became known about its decline to 3.5%. At the same time, wages increased by 0.5% monthly with expectations of +0.3% m/m. Thus, all three reports turned out to be strong, and I am a little surprised that the US currency rose so weakly on Friday. The passivity of the market in recent weeks may play a role here. Although the peak of wave 4 has been detected, and it seems that the wave marking does not require adjustments, we have observed more horizontal movement in the last few weeks. So far, three waves are being viewed inside wave 4, and the first and second of five are being viewed inside the proposed wave 5. But for the current wave markup to be maintained, a new increase in demand for the US currency is needed. If not, then the current structure may be broken.

General conclusions.

Based on the analysis, I conclude that the construction of the downward trend section continues. If so, it is now possible to sell the instrument with targets located near the estimated 0.9397 mark, which is equivalent to 423.6% Fibonacci, for each MACD signal "down" in the calculation of the construction of wave 5. Wave 4 can be completed.

This image is no longer relevant

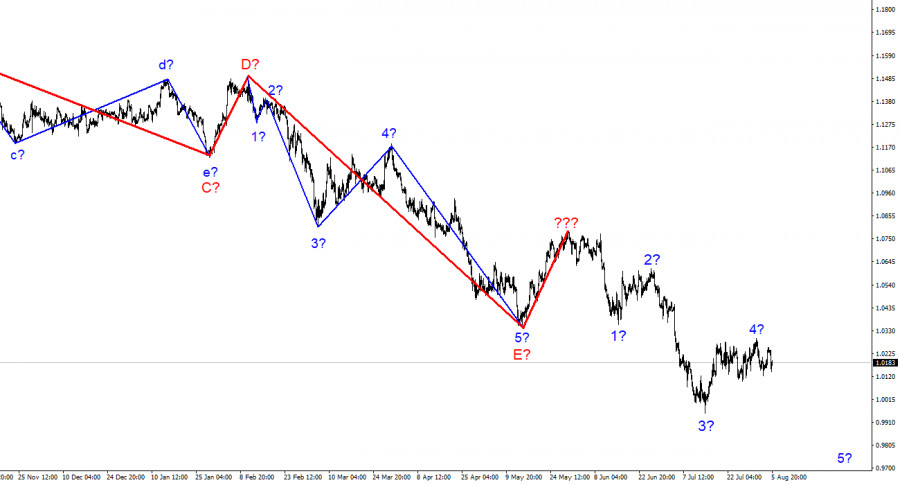
At the higher wave scale, the wave marking of the descending trend segment becomes noticeably more complicated and lengthens. It can take on almost any length, so I think it's best to isolate three and five-wave standard wave structures and work on them.

Chin Zhao,
ผู้เชี่ยวชาญด้านการวิเคราะห์ของ InstaForex
© 2007-2025
เลือกช่วงเวลา
5
นาที
15
นาที
30
นาที
1
ชั่วโมง
4
ชั่วโมง
1
วัน
1
สัปดาห์
รับผลกำไรจากการเปลี่ยนแปลงอัตราสกุลเงินดิจิทัลกับ InstaForex.
ดาวน์โหลด MetaTrader 4 และเปิดการซื้อขายครั้งแรกของคุณ.
USD/CAD: การวิเคราะห์และการพยากรณ์ คู่เงิน USD/CAD กำลังแสดงการฟื้นตัวเล็กน้อยจากระดับที่ต่ำกว่า 1.3600 โดยย้อนไปเกือบทั้งหมดของการสูญเสียในวันที่ผ่านมา โดยได้รับการสนับสนุนจากการฟื้นตัวของดอลลาร์สหรัฐ นอกจากนี้ ความกังวลเกี่ยวกับการหยุดชะงักในการจัดหาน้ำมันในตะวันออกกลางกำลังผลักดันราคาน้ำมันดิบให้พุ่งขึ้นอย่างรวดเร็ว ทำให้ราคาของน้ำมันแตะระดับสูงสุดในรอบห้าเดือน เนื่องจากเงินดอลลาร์แคนาดาเป็นสกุลเงินที่เชื่อมโยงกับสินค้าโภคภัณฑ์ ราคาน้ำมันจึงส่งผลต่อค่าของมันเป็นอย่างมาก ประกอบกับความเป็นไปได้ที่ลดลงของการปรับลดอัตราดอกเบี้ยเพิ่มเติมจากธนาคารกลางแคนาดาและความคาดหวังต่อข้อตกลงการค้าระหว่างสหรัฐอเมริกาและแคนาดา ปัจจัยเหล่านี้ช่วยสนับสนุนเงินดอลลาร์แคนาดา โอกาสทางการค้าที่ดีขึ้นและนโยบายการเงินของแคนาดาที่มีเสถียรภาพอาจช่วยให้
  • Grand Choice
    Contest by
    InstaForex
    InstaForex always strives to help you
    fulfill your biggest dreams.
    เข้าร่วมการแข่งขัน


บทความแนะนำ

การวิเคราะห์ EUR/USD ประจำวันที่ 11 มิถุนายน 2025

โครงสร้างของคลื่นในกราฟ 4 ชั่วโมงสำหรับคู่เงิน EUR/USD ได้เปลี่ยนเป็นการก่อตัวที่มีแนวโน้มเพิ่มขึ้นอย่างแข็งแกร่งและยังคงรักษารูปแบบนี้ไว้ ผมเชื่อว่าไม่มีข้อสงสัยว่านี่เป็นผลมาจากการเปลี่ยนแปลงนโยบายการค้าของสหรัฐฯ อย่างแน่นอน จนถึงวันที่ 28 กุมภาพันธ์ เมื่อค่าเงินดอลลาร์สหรัฐฯ เริ่มอ่อนค่าลงอย่างมาก โครงสร้างของคลื่นได้บ่งชี้ถึงแนวโน้มขาลงอย่างชัดเจน โดยคลื่นแก้ไขที่

Chin Zhao 19:00 2025-06-11 UTC+2

วิเคราะห์ GBP/USD วันที่ 11 มิถุนายน 2025

โครงสร้างคลื่นของ GBP/USD ยังคงบ่งบอกถึงการก่อตัวของรูปแบบคลื่นขาขึ้น รูปภาพของคลื่นนี้เกือบจะเหมือนกันกับคลื่นของ EUR/USD จนถึงวันที่ 28 กุมภาพันธ์ เราสังเกตเห็นการก่อตัวของโครงสร้างปรับฐานที่ชัดเจนซึ่งไม่มีข้อสงสัยใด ๆ อย่างไรก็ตาม ความต้องการในเงินดอลลาร์สหรัฐฯ เริ่มลดลงอย่างรวดเร็วในเวลาต่อมา ท้ายที่สุดนำไปสู่การกลับตัวของเทรนด์ คลื่น

Chin Zhao 18:51 2025-06-11 UTC+2

การวิเคราะห์ GBP/USD วันที่ 9 มิถุนายน 2025

สำหรับคู่สกุลเงิน GBP/USD รูปแบบคลื่นยังคงบ่งบอกถึงการก่อตัวของโครงสร้างคลื่นแรงกระตุ้นที่ขึ้นไปด้านบน รูปแบบคลื่นนี้คล้ายคลึงกับคู่สกุลเงิน EUR/USD จนถึงวันที่ 28 กุมภาพันธ์ เราได้เห็นโครงสร้างการแก้ไขที่น่าเชื่อถือที่ไม่มีข้อสงสัยใด ๆ เกิดขึ้น อย่างไรก็ตาม มีการลดลงของความต้องการในเงินดอลลาร์สหรัฐอย่างรวดเร็ว นำไปสู่การกลับทิศทางของแนวโน้มเป็นทิศทางขึ้น คลื่นที่

Chin Zhao 20:16 2025-06-09 UTC+2

วิเคราะห์ EUR/USD วันที่ 9 มิถุนายน 2025

โครงสร้างคลื่นบนกราฟ EUR/USD แบบ 4 ชั่วโมงได้เปลี่ยนไปเป็นรูปแบบขาขึ้นและยังคงรักษาโครงสร้างนี้อยู่ ฉันเชื่อว่ามีข้อสงสัยน้อยมากว่าการเปลี่ยนแปลงนี้เกิดขึ้นจากนโยบายการค้าของสหรัฐฯ รูปแบบคลื่นในตอนนี้แสดงให้เห็นถึงแนวโน้มขาลงที่ชัดเจนเกิดขึ้นช่วงวันที่ 28 กุมภาพันธ์เมื่อเงินดอลลาร์สหรัฐฯเริ่มลดลงอย่างรวดเร็ว มีการสร้างคลื่นแก้ไขที่ 2 ขึ้นมา อย่างไรก็ตาม การประกาศอัตราภาษีจาก Trump

Chin Zhao 20:09 2025-06-09 UTC+2

การวิเคราะห์ EUR/USD ประจำวันที่ 5 มิถุนายน 2025

รูปแบบคลื่นในกราฟ 4 ชั่วโมงของคู่สกุลเงิน EUR/USD ได้เปลี่ยนแปลงเป็นโครงสร้างที่เป็นขาขึ้นและยังคงรักษารูปแบบนี้เอาไว้ ฉันเชื่อว่ามีความสงสัยเล็กน้อยว่าการเปลี่ยนแปลงนี้เกิดขึ้นเนื่องจากนโยบายการค้าใหม่ของสหรัฐฯ เพียงอย่างเดียว จนถึงวันที่ 28 กุมภาพันธ์ เมื่อตอนที่ค่าเงินดอลลาร์สหรัฐเริ่มร่วงลงอย่างรวดเร็ว ทั้งรูปแบบคลื่นทั้งหมดก็ยังคงดูเหมือนแนวโน้มขาลงที่น่าเชื่อถือ โดยมีคลื่นปรับแก้ 2 กำลังก่อตัวขึ้น

Chin Zhao 20:03 2025-06-05 UTC+2

การวิเคราะห์ GBP/USD ณ วันที่ 4 มิถุนายน 2025

รูปแบบคลื่นสำหรับ GBP/USD ยังคงบ่งบอกถึงการก่อตัวของโครงสร้างคลื่นที่มีแรงผลักดันขึ้น รูปแบบคลื่นมีความเหมือนกับการระบายที่เกิดขึ้นกับคู่เงิน EUR/USD จนถึงวันที่ 28 กุมภาพันธ์ เราสังเกตเห็นการก่อตัวของโครงสร้างการแก้ไขที่มีความชัดเจน และไม่มีข้อสงสัยใดๆ อย่างไรก็ตาม หลังจากนั้น ความต้องการสำหรับสกุลเงินดอลลาร์สหรัฐเริ่มลดลงอย่างรวดเร็ว ส่งผลให้เกิดการกลับตัวของแนวโน้มเป็นขาขึ้น คลื่นลูกที่

Chin Zhao 18:48 2025-06-04 UTC+2

การวิเคราะห์ EUR/USD ประจำวันที่ 3 มิถุนายน 2025

รูปแบบคลื่นในกราฟ 4 ชั่วโมงสำหรับ EUR/USD ได้เปลี่ยนแปลงไปเป็นโครงสร้างขาขึ้น และยังคงเป็นเช่นนั้นอยู่ ผมเชื่อว่าไม่มีข้อสงสัยเลยว่าการเปลี่ยนแปลงนี้เกิดขึ้นมาโดยเฉพาะเนื่องจากนโยบายการค้าของสหรัฐฯ ใหม่ จนถึงวันที่ 28 กุมภาพันธ์ เมื่อการลดลงของดอลลาร์สหรัฐฯ เริ่มกลับตัว รูปแบบคลื่นดูเหมือนจะเป็นส่วนหนึ่งของเทรนด์ขาลงที่น่าเชื่อถือ โดยมีคลื่นปรับฐานที่

Chin Zhao 19:38 2025-06-03 UTC+2

การวิเคราะห์ GBP/USD วันที่ 3 มิถุนายน 2025

โครงสร้างคลื่นสำหรับคู่ GBP/USD ยังคงบ่งชี้ถึงการพัฒนาของรูปแบบคลื่นที่ก้าวไปในทิศทางขึ้น การเกิดขึ้นของรูปแบบคลื่นนี้คล้ายคลึงกับคู่ EUR/USD จนกระทั่งถึงวันที่ 28 กุมภาพันธ์ เราสังเกตเห็นการเกิดโครงสร้างการปรับตัวที่น่าเชื่อถือ ซึ่งไม่ทิ้งพื้นที่ให้สงสัย อย่างไรก็ตาม ความต้องการเงินดอลล่าร์สหรัฐเริ่มลดลงอย่างรวดเร็วจนกระทั่งเกิดการพลิกผันไปในทางขึ้น คลื่น 2 ของแนวโน้มนี้มีรูปคลื่นเพียงคลื่นเดียว

Chin Zhao 19:32 2025-06-03 UTC+2

วิเคราะห์ EUR/USD ประจำวันที่ 2 มิถุนายน 2025

โครงสร้างคลื่นบนชาร์ต 4 ชั่วโมงสำหรับ EUR/USD ได้เปลี่ยนเป็นรูปแบบขาขึ้นและยังคงรักษารูปแบบนี้ไว้ ฉันเชื่อว่าไม่มีข้อสงสัยว่า การเปลี่ยนแปลงนี้เกิดขึ้นเพียงเพราะนโยบายการค้าของสหรัฐฯ ใหม่เท่านั้น ก่อนวันที่ 28 กุมภาพันธ์ ซึ่งเป็นช่วงที่ค่าเงินดอลลาร์สหรัฐเริ่มลดลงอย่างมาก โครงสร้างคลื่นปรากฏเป็นสองช่วงแนวโน้มขาลงที่น่าเชื่อถือ กำลังมีการสร้างคลื่นที่แก้ไขที่

Chin Zhao 19:07 2025-06-02 UTC+2

การวิเคราะห์ GBP/USD วันที่ 2 มิถุนายน 2025

โครงสร้างคลื่นของ GBP/USD ยังคงแสดงถึงการก่อตัวของรูปแบบคลื่นแรงกระตุ้นขาขึ้น โครงสร้างของคลื่นมีความใกล้เคียงกับของ EUR/USD จนถึงวันที่ 28 กุมภาพันธ์ เราสังเกตเห็นรูปแบบโครงสร้างที่มีความน่าเชื่อถือ โดยไม่มีข้อสงสัยแต่อย่างใด อย่างไรก็ตาม ความต้องการดอลลาร์สหรัฐจากนั้นเริ่มลดลงอย่างรวดเร็ว ส่งผลให้เกิดการกลับตัวของแนวโน้ม คลื่นที่

Chin Zhao 19:05 2025-06-02 UTC+2
หากไม่สะดวกคุยในตอนนี้
ระบุคำถามไว้ได้ใน แชท.
Widget callback
 

Dear visitor,

Your IP address shows that you are currently located in the USA. If you are a resident of the United States, you are prohibited from using the services of InstaFintech Group including online trading, online transfers, deposit/withdrawal of funds, etc.

If you think you are seeing this message by mistake and your location is not the US, kindly proceed to the website. Otherwise, you must leave the website in order to comply with government restrictions.

Why does your IP address show your location as the USA?

  • - you are using a VPN provided by a hosting company based in the United States;
  • - your IP does not have proper WHOIS records;
  • - an error occurred in the WHOIS geolocation database.

Please confirm whether you are a US resident or not by clicking the relevant button below. If you choose the wrong option, being a US resident, you will not be able to open an account with InstaForex anyway.

We are sorry for any inconvenience caused by this message.