Analyzing Thursday's trades:
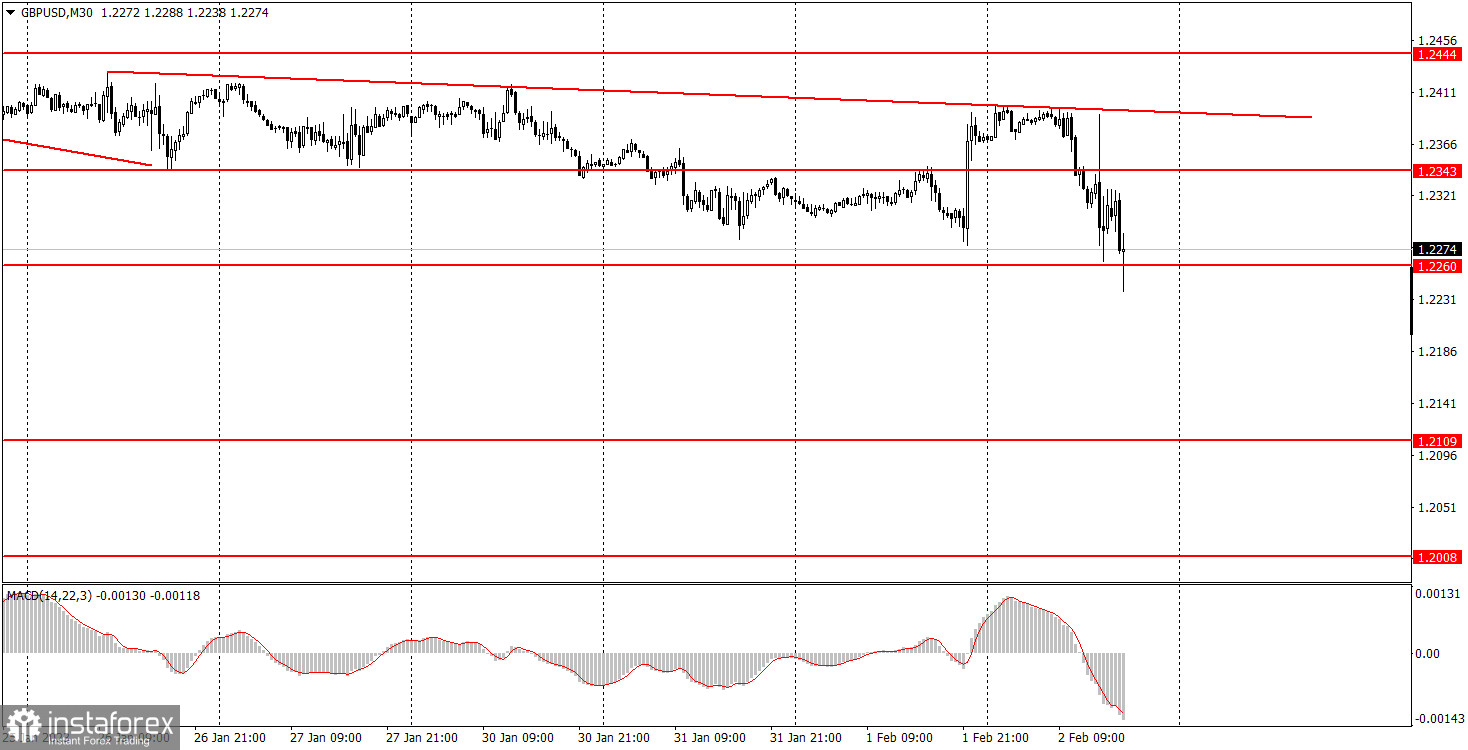
GBP/USD on 30M chart
GBP/USD showed similar movements to EUR/USD. It even seems that the market reacted to only one event (Federal Reserve meeting), when in fact, the Bank of England and the European Central Bank announced the results of their own respective meetings. They were similar in many aspects, e.g. in the size of the key rate hike. As I mentioned earlier, the market played out the BoE and ECB rate hikes in advance. In addition, we have already witnessed how illogical the markets reacted to the hawkish results of the Fed meeting. Therefore, in the end, we can even say that the pound's final decline was justified. Technically, the pound remains within the horizontal channel, in which it has been staying for three weeks - 1.2260-1.2444. If it is not possible to overcome the lower limit, the pair will not fall further, which I expect. Nevertheless, we have formed a new descending trend line, which might push the price down a little bit. The situation has not cleared up after three central bank meetings. Friday is also important due to the U.S. labor market and unemployment data. We are getting ready for new "flights" of the pair.
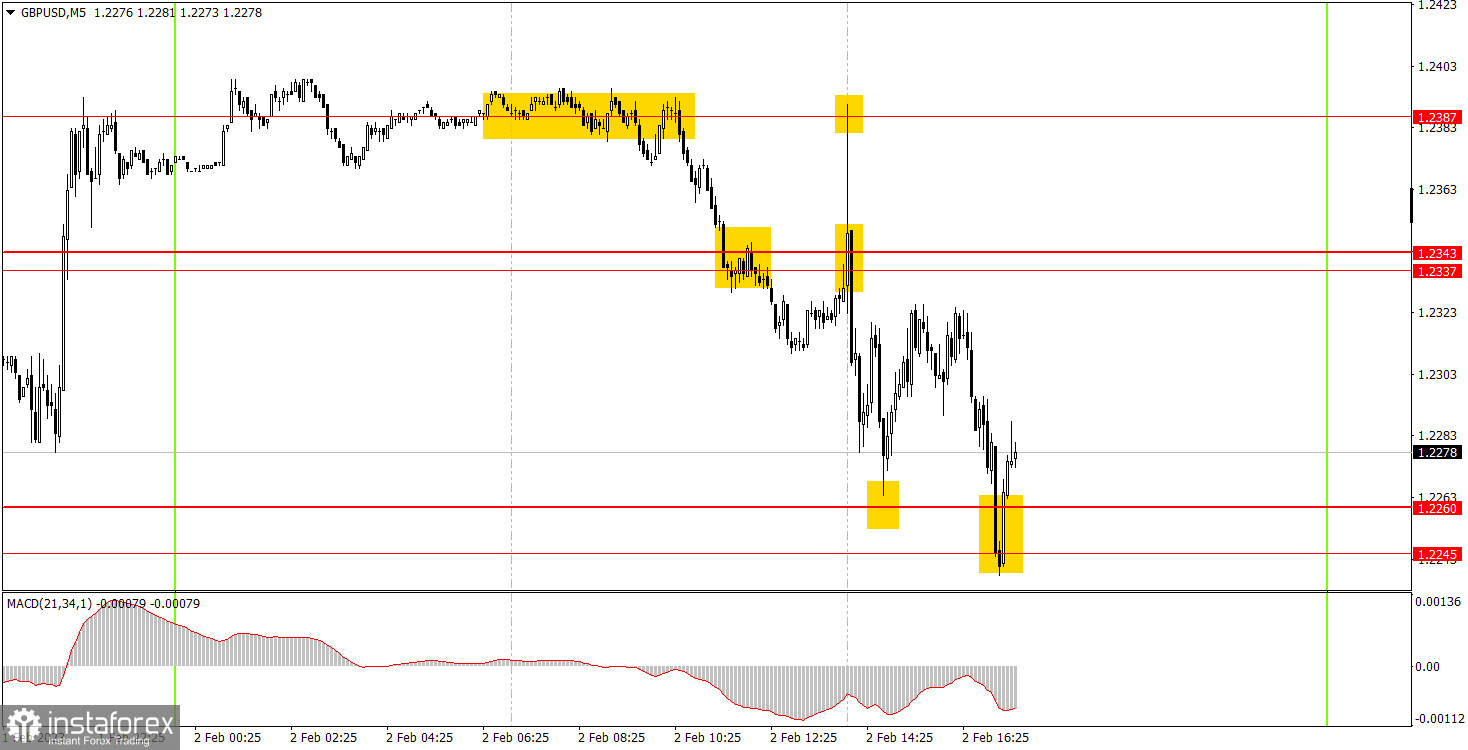
GBP/USD on M5 chart
Just like it was for the euro, the European trading session was relatively quiet for the pound as well. The "flights" began later, when the BoE announced the results of its meeting. Therefore, the first signal to sell near 1.2387 should have been worked out. The price had time to go down to the 1.2337-1.2343 area before the BoE meeting and even overcame it. Therefore, the position should have been closed manually closer to the opening of the US trading session. Its profit was about 55 pips. Further, the pair began to "fly" from side to side, therefore it was not advisable to open trading positions, it was too dangerous.
Trading tips on Friday
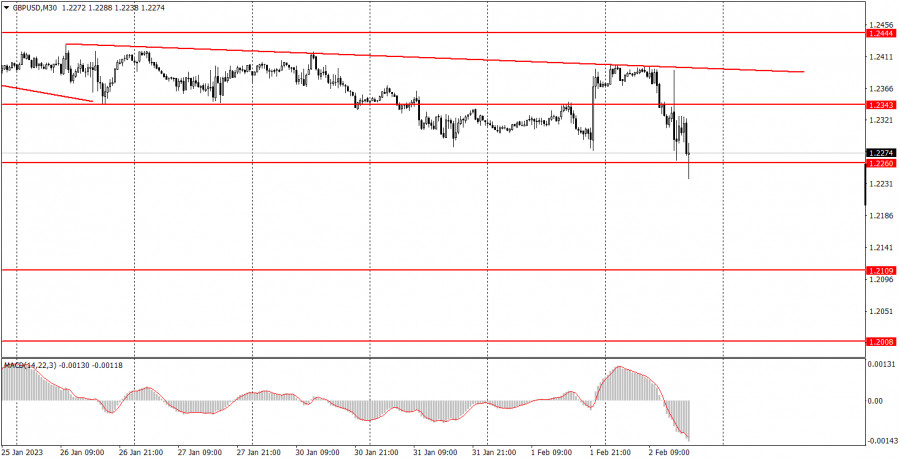
On the 30-minute chart, GBP/USD continues to move inside the 1.2260-1.2444 channel. Important events of the last 24 hours failed to bring the pair out of it. Therefore, it is currently impossible to say anything new about the technical picture. Maybe on Friday, under the pressure of the US data, the pair will be able to get out of the range. On the 5-minute chart, it is recommended to trade at the levels 1.2064-1.2079, 1.2109, 1.2171-1.2179, 1.2245-1.2260, 1.2337-1.2343, 1.2387, 1.2444-1.2471, 1.2577-1.2597. As soon as the price passes 20 pips in the right direction, you should set a Stop Loss to breakeven. On Friday, services PMi will be released in the UK. Meanwhile, the US macroeconomic calendar will be more extensive, particularly NonFarm Payrolls, unemployment and the ISM service sector index. We expect high volatility.
Basic rules of the trading system:
1) The strength of the signal is determined by the time it took the signal to form (a rebound or a breakout of the level). The quicker it is formed, the stronger the signal is.
2) If two or more positions were opened near a certain level based on a false signal (which did not trigger a Take Profit or test the nearest target level), then all subsequent signals at this level should be ignored.
3) When trading flat, a pair can form multiple false signals or not form them at all. In any case, it is better to stop trading at the first sign of a flat movement.
4) Trades should be opened in the period between the start of the European session and the middle of the US trading hours when all positions must be closed manually.
5) You can trade using signals from the MACD indicator on the 30-minute time frame only amid strong volatility and a clear trend that should be confirmed by a trendline or a trend channel.
6) If two levels are located too close to each other (from 5 to 15 pips), they should be considered support and resistance levels.
On the chart:
Support and Resistance levels are the levels that serve as targets when buying or selling the pair. You can place Take Profit near these levels.
Red lines are channels or trend lines that display the current trend and show in which direction it is better to trade now.
The MACD indicator (14, 22, and 3) consists of a histogram and a signal line. When they cross, this is a signal to enter the market. It is recommended to use this indicator in combination with trend patterns (channels and trendlines).
Important announcements and economic reports that can be found on the economic calendar can seriously influence the trajectory of a currency pair. Therefore, at the time of their release, we recommend trading as carefully as possible or exiting the market in order to avoid sharp price fluctuations.
Beginners on Forex should remember that not every single trade has to be profitable. The development of a clear strategy and money management is the key to success in trading over a long period of time.