empty
03.02.2023 12:00 AM
How to trade GBP/USD on February 3. Simple trading tips and analysis for beginners

Analyzing Thursday's trades:

GBP/USD on 30M chart
This image is no longer relevant

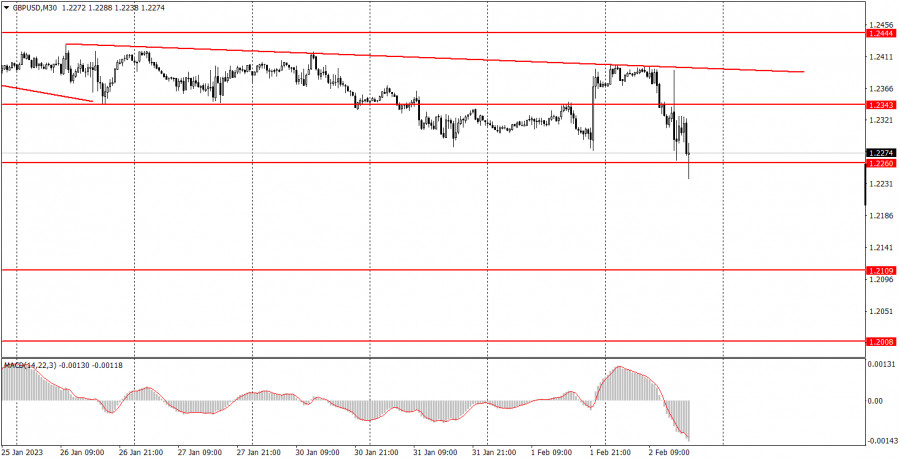
GBP/USD showed similar movements to EUR/USD. It even seems that the market reacted to only one event (Federal Reserve meeting), when in fact, the Bank of England and the European Central Bank announced the results of their own respective meetings. They were similar in many aspects, e.g. in the size of the key rate hike. As I mentioned earlier, the market played out the BoE and ECB rate hikes in advance. In addition, we have already witnessed how illogical the markets reacted to the hawkish results of the Fed meeting. Therefore, in the end, we can even say that the pound's final decline was justified. Technically, the pound remains within the horizontal channel, in which it has been staying for three weeks - 1.2260-1.2444. If it is not possible to overcome the lower limit, the pair will not fall further, which I expect. Nevertheless, we have formed a new descending trend line, which might push the price down a little bit. The situation has not cleared up after three central bank meetings. Friday is also important due to the U.S. labor market and unemployment data. We are getting ready for new "flights" of the pair.

GBP/USD on M5 chart

This image is no longer relevant

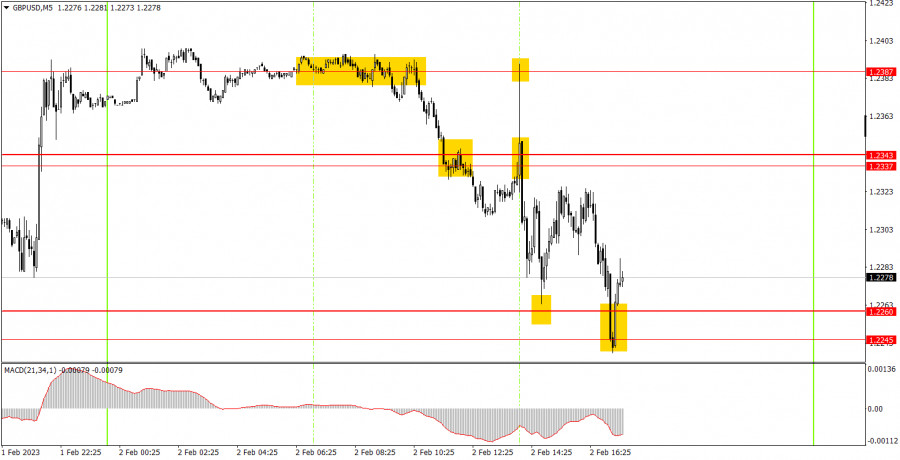
Just like it was for the euro, the European trading session was relatively quiet for the pound as well. The "flights" began later, when the BoE announced the results of its meeting. Therefore, the first signal to sell near 1.2387 should have been worked out. The price had time to go down to the 1.2337-1.2343 area before the BoE meeting and even overcame it. Therefore, the position should have been closed manually closer to the opening of the US trading session. Its profit was about 55 pips. Further, the pair began to "fly" from side to side, therefore it was not advisable to open trading positions, it was too dangerous.

Trading tips on Friday

On the 30-minute chart, GBP/USD continues to move inside the 1.2260-1.2444 channel. Important events of the last 24 hours failed to bring the pair out of it. Therefore, it is currently impossible to say anything new about the technical picture. Maybe on Friday, under the pressure of the US data, the pair will be able to get out of the range. On the 5-minute chart, it is recommended to trade at the levels 1.2064-1.2079, 1.2109, 1.2171-1.2179, 1.2245-1.2260, 1.2337-1.2343, 1.2387, 1.2444-1.2471, 1.2577-1.2597. As soon as the price passes 20 pips in the right direction, you should set a Stop Loss to breakeven. On Friday, services PMi will be released in the UK. Meanwhile, the US macroeconomic calendar will be more extensive, particularly NonFarm Payrolls, unemployment and the ISM service sector index. We expect high volatility.

Basic rules of the trading system:

1) The strength of the signal is determined by the time it took the signal to form (a rebound or a breakout of the level). The quicker it is formed, the stronger the signal is.

2) If two or more positions were opened near a certain level based on a false signal (which did not trigger a Take Profit or test the nearest target level), then all subsequent signals at this level should be ignored.

3) When trading flat, a pair can form multiple false signals or not form them at all. In any case, it is better to stop trading at the first sign of a flat movement.

4) Trades should be opened in the period between the start of the European session and the middle of the US trading hours when all positions must be closed manually.

5) You can trade using signals from the MACD indicator on the 30-minute time frame only amid strong volatility and a clear trend that should be confirmed by a trendline or a trend channel.

6) If two levels are located too close to each other (from 5 to 15 pips), they should be considered support and resistance levels.

On the chart:

Support and Resistance levels are the levels that serve as targets when buying or selling the pair. You can place Take Profit near these levels.

Red lines are channels or trend lines that display the current trend and show in which direction it is better to trade now.

The MACD indicator (14, 22, and 3) consists of a histogram and a signal line. When they cross, this is a signal to enter the market. It is recommended to use this indicator in combination with trend patterns (channels and trendlines).

Important announcements and economic reports that can be found on the economic calendar can seriously influence the trajectory of a currency pair. Therefore, at the time of their release, we recommend trading as carefully as possible or exiting the market in order to avoid sharp price fluctuations.

Beginners on Forex should remember that not every single trade has to be profitable. The development of a clear strategy and money management is the key to success in trading over a long period of time.

Paolo Greco,
الخبير التحليلي لدى شركة إنستافوركس
© 2007-2025
حدد الإطار الزمني
5
د
15
د
30
د
1
س
4
ساعات
1
يوم
1
أسبوع
كسب عائد من تغيرات أسعار العملات المشفرة مع إنستافوركس.
قم بتحميل منصة التداول ميتاتريدر 4 وافتح أول صفقة.
  • Grand Choice
    Contest by
    InstaForex
    InstaForex always strives to help you
    fulfill your biggest dreams.
    انضم إلى المسابقة

المقالات الموصى بها

توصيات وتحليل التداول لزوج الجنيه الإسترليني/الدولار الأمريكي في 16 يونيو: الجنيه لا يشعر بأي مقاومة من الدولار

يوم الجمعة، واصل زوج العملات GBP/USD حركته الصعودية. لفهم ما يحدث مع الجنيه الإسترليني بشكل أفضل، من الأفضل الانتقال إلى الإطار الزمني اليومي. هناك، نلاحظ ارتفاعًا قويًا بدأ تحديدًا

Paolo Greco 04:53 2025-06-16 UTC+2

توصيات وتحليل التداول لزوج اليورو/الدولار الأمريكي في 16 يونيو: هل سيكون هناك عاصفة جديدة يوم الاثنين؟

خلال جلسة يوم الاثنين، تحرك زوج العملات EUR/USD في كلا الاتجاهين. أولاً، كان هناك انخفاض حاد في الأسعار (لمن لم يكن نائمًا) بسبب هجوم إسرائيل على إيران

Paolo Greco 04:53 2025-06-16 UTC+2

GBP/USD: خطة التداول للجلسة الأمريكية في 13 يونيو (مراجعة تداولات الصباح)

في توقعاتي الصباحية، قمت بتسليط الضوء على مستوى 1.3531 وخططت لاتخاذ قرارات التداول بناءً عليه. دعونا نلقي نظرة على الرسم البياني لمدة 5 دقائق ونحلل ما حدث. أدى الانخفاض يليه

Miroslaw Bawulski 12:37 2025-06-13 UTC+2

EUR/USD: خطة التداول للجلسة الأمريكية في 13 يونيو (مراجعة التداولات الصباحية)

في توقعاتي الصباحية، قمت بتسليط الضوء على مستوى 1.1556 وخططت لاتخاذ قرارات دخول السوق بناءً عليه. دعونا نلقي نظرة على الرسم البياني لمدة 5 دقائق ونحلل ما حدث. أدى الارتفاع

Miroslaw Bawulski 12:31 2025-06-13 UTC+2

كيفية تداول زوج الجنيه الإسترليني/الدولار الأمريكي في 13 يونيو؟ نصائح بسيطة وتحليل التداول للمبتدئين

يوم الخميس، أظهر زوج الجنيه الإسترليني/الدولار الأمريكي حركة صعودية قوية نسبيًا، رغم أن الجنيه الإسترليني شهد تراجعات خلال اليوم. كانت هناك العديد من التطورات الإخبارية. على سبيل المثال، خلال الجلسة

Paolo Greco 06:31 2025-06-13 UTC+2

كيفية تداول زوج اليورو/الدولار الأمريكي في 13 يونيو؟ نصائح بسيطة وتحليل التداول للمبتدئين

شهد زوج العملات اليورو/الدولار الأمريكي يوم الخميس وخلال الليل حتى يوم الجمعة "سباقًا على الطريقة الأمريكية". خلال اليومين الماضيين، تراجع الدولار الأمريكي مرة أخرى مع استمرار الاحتجاجات والاضطرابات الجماهيرية

Paolo Greco 06:31 2025-06-13 UTC+2

توصيات وتحليل التداول لزوج الجنيه الإسترليني/الدولار الأمريكي في 13 يونيو: الناتج المحلي الإجمالي الضعيف أفسد الصورة للجنيه.

يوم الخميس، واصل زوج العملات GBP/USD التحرك صعودًا. ومع ذلك، وبشكل مفاجئ إلى حد ما، ارتفع الجنيه الإسترليني هذا الأسبوع أقل من اليورو. تعرضت العملة البريطانية للضغط أولاً من تقارير

Paolo Greco 03:41 2025-06-13 UTC+2

توصيات وتحليل التداول لزوج اليورو/الدولار الأمريكي في 13 يونيو: ترامب يحذر من زيادة الرسوم الجمركية

واصل زوج العملات EUR/USD حركته الصعودية القوية يوم الخميس، والتي بدأت يوم الأربعاء. وبدأت حركة تصحيحية هابطة في نهاية اليوم، لكنها كانت أضعف بكثير من الارتفاع السابق. بدأت الموجة التالية

Paolo Greco 03:40 2025-06-13 UTC+2

كيفية تداول زوج الجنيه الإسترليني/الدولار الأمريكي في 12 يونيو؟ نصائح بسيطة وتحليل التداول للمبتدئين

يوم الأربعاء، تحرك زوج الجنيه الإسترليني/الدولار الأمريكي بطريقة مشابهة لزوج اليورو/الدولار الأمريكي. أصبح تقرير التضخم الأمريكي محركًا جديدًا لانخفاض الدولار الأمريكي، على الرغم من أن الأرقام لم تكن كارثية

Paolo Greco 06:05 2025-06-12 UTC+2

كيفية تداول زوج اليورو/الدولار الأمريكي في 12 يونيو؟ نصائح بسيطة وتحليل التداول للمبتدئين

يوم الأربعاء، استأنف زوج العملات EUR/USD اتجاهه الصعودي الذي استمر لأكثر من أربعة أشهر. بشكل أكثر دقة، استمر هذا الاتجاه منذ أن أصبح دونالد ترامب رئيسًا. كما نرى، يرتفع الزوج

Paolo Greco 06:05 2025-06-12 UTC+2
لا تستطيع التحدث الآن؟
اطرح سؤالك في الدردشة.
Widget callback
 

Dear visitor,

Your IP address shows that you are currently located in the USA. If you are a resident of the United States, you are prohibited from using the services of InstaFintech Group including online trading, online transfers, deposit/withdrawal of funds, etc.

If you think you are seeing this message by mistake and your location is not the US, kindly proceed to the website. Otherwise, you must leave the website in order to comply with government restrictions.

Why does your IP address show your location as the USA?

  • - you are using a VPN provided by a hosting company based in the United States;
  • - your IP does not have proper WHOIS records;
  • - an error occurred in the WHOIS geolocation database.

Please confirm whether you are a US resident or not by clicking the relevant button below. If you choose the wrong option, being a US resident, you will not be able to open an account with InstaForex anyway.

We are sorry for any inconvenience caused by this message.