empty
29.09.2023 01:38 PM
EUR/USD. September 29th. Time for a pause

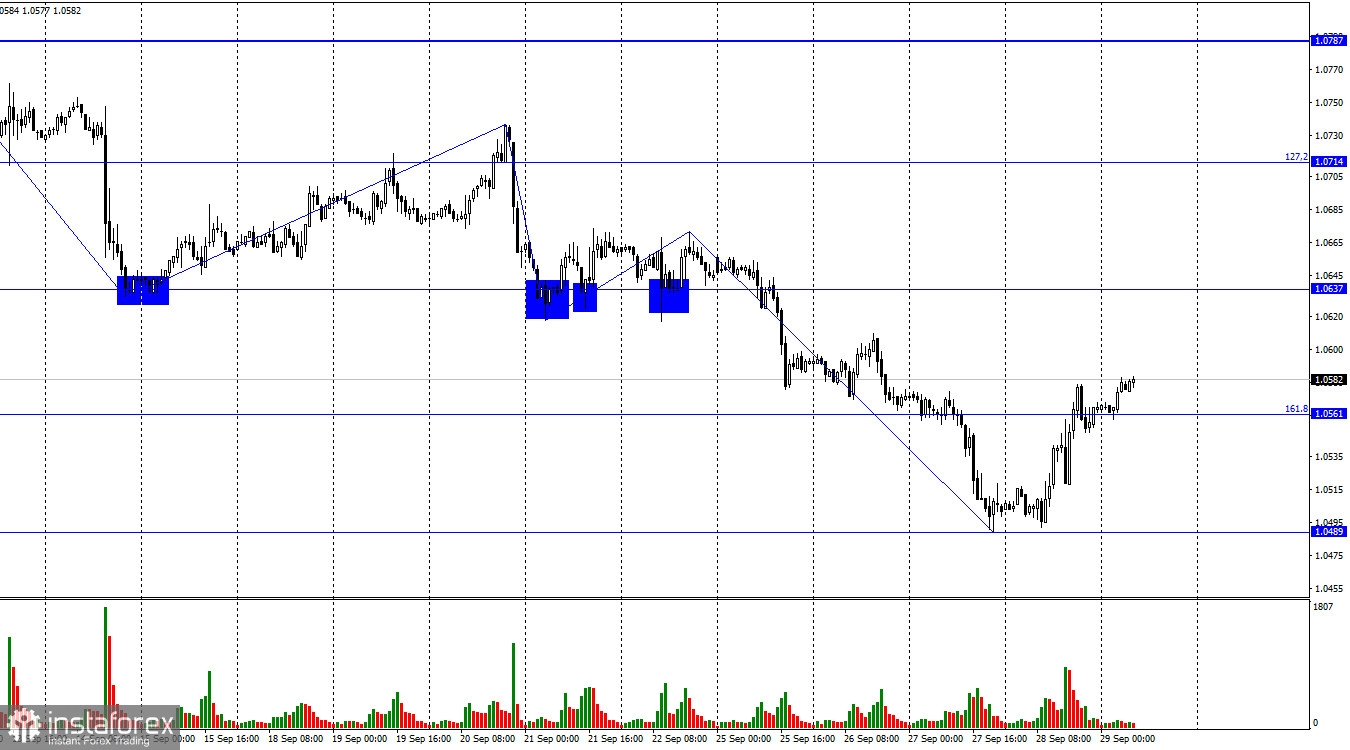
The EUR/USD pair made a reversal in favor of the European currency on Thursday, returning to the corrective level of 161.8% (1.0561). The consolidation above it allows us to expect further growth towards the next level at 1.0637. A rebound from the 1.0637 level will favor the US currency and a resumption of the decline towards the levels of 1.0561 and 1.0489. Closing above 1.0637 allows us to anticipate further growth towards the Fibonacci level of 127.2% (1.0714).

This image is no longer relevant

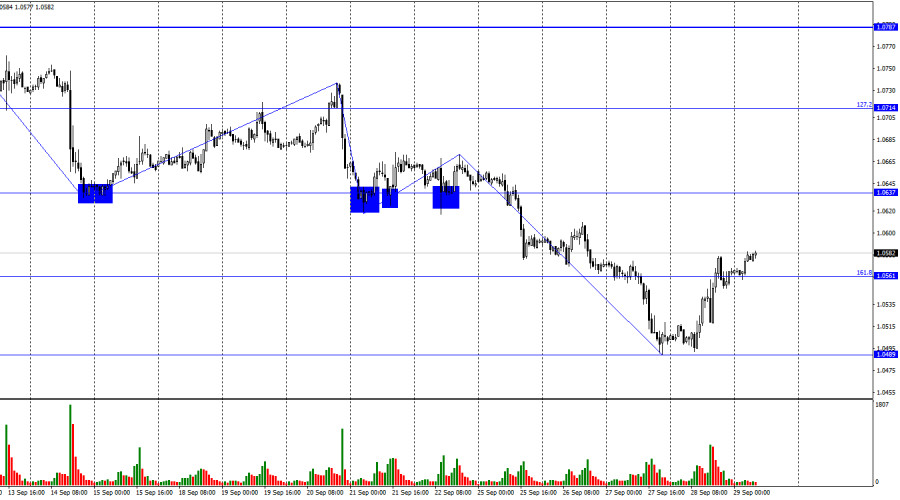
A new upward wave has begun. However, at the moment, this wave does not change anything in the overall picture. The "bearish" trend remains and will continue until the last peak is surpassed (around the 1.0665 level). Theoretically, this is possible today. Another possible sign will be the formation of a new downward wave that does not break the lows of yesterday. Thus, the beginnings of a new "bullish" trend are now present, but it is still too early to draw conclusions, especially considering the information background of Friday, which is quite strong.

Yesterday, there were two interesting reports that traders paid attention to. In Germany, the Consumer Price Index for September was released, and official data showed a decrease to 4.5%, which was even lower than expected. The Harmonized Index of Consumer Prices slowed down to 4.3% y/y. I don't consider this very good news for the euro from the ECB's point of view, but traders may have been buying the euro based on this report.

The GDP in the United States in the second quarter turned out to be more predictable, as the actual value coincided with the forecast: +2.1%. I believe that yesterday, the desire of the bears to take a break and rest played a bigger role than the two reports mentioned above.

This image is no longer relevant

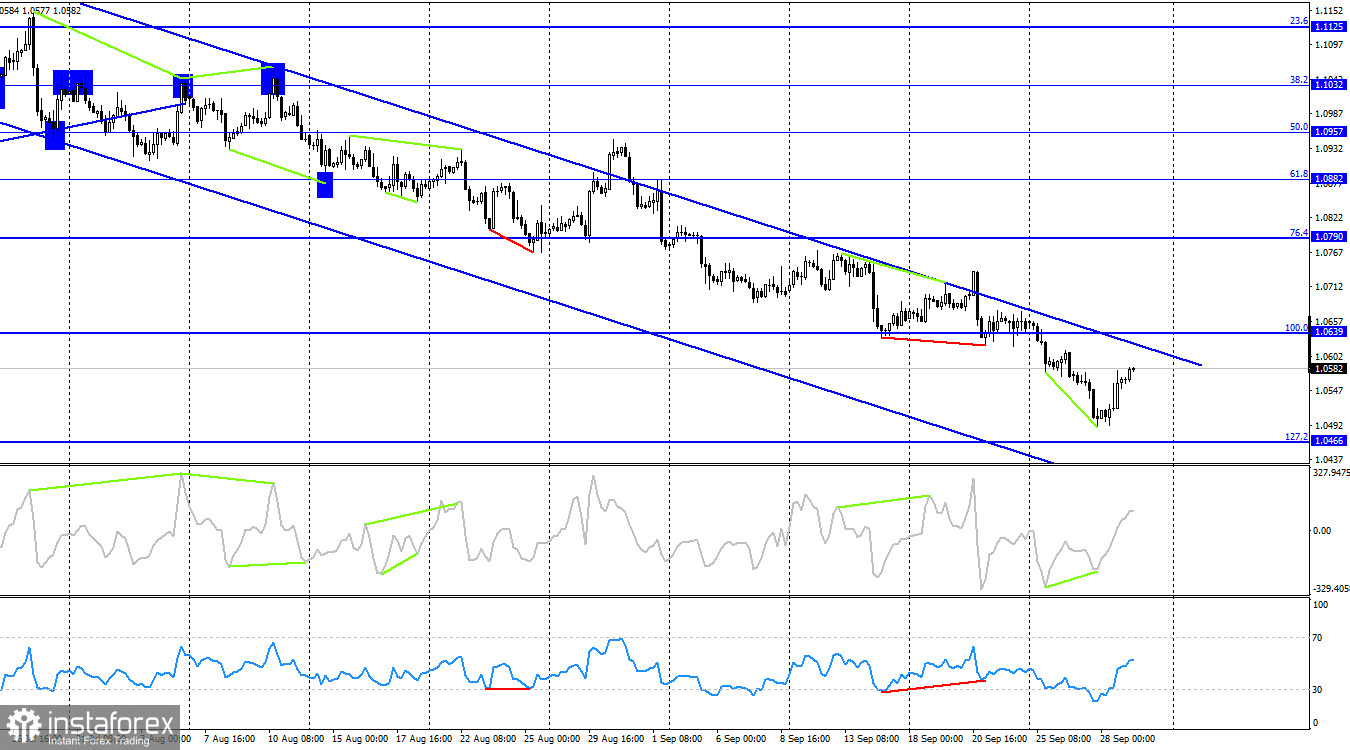
On the 4-hour chart, the pair has made a reversal in favor of the EU currency after the formation of a "bullish" divergence on the CCI indicator. The growth process can continue towards the upper line of the descending trend corridor and the correction level of 100.0% (1.0639). A rebound from any of these barriers will maintain the "bearish" trend and suggest a resumption of the decline towards the corrective level of 127.2% (1.0466). Closing above the 1.0639 level is likely to indicate the end of the "bearish" trend.

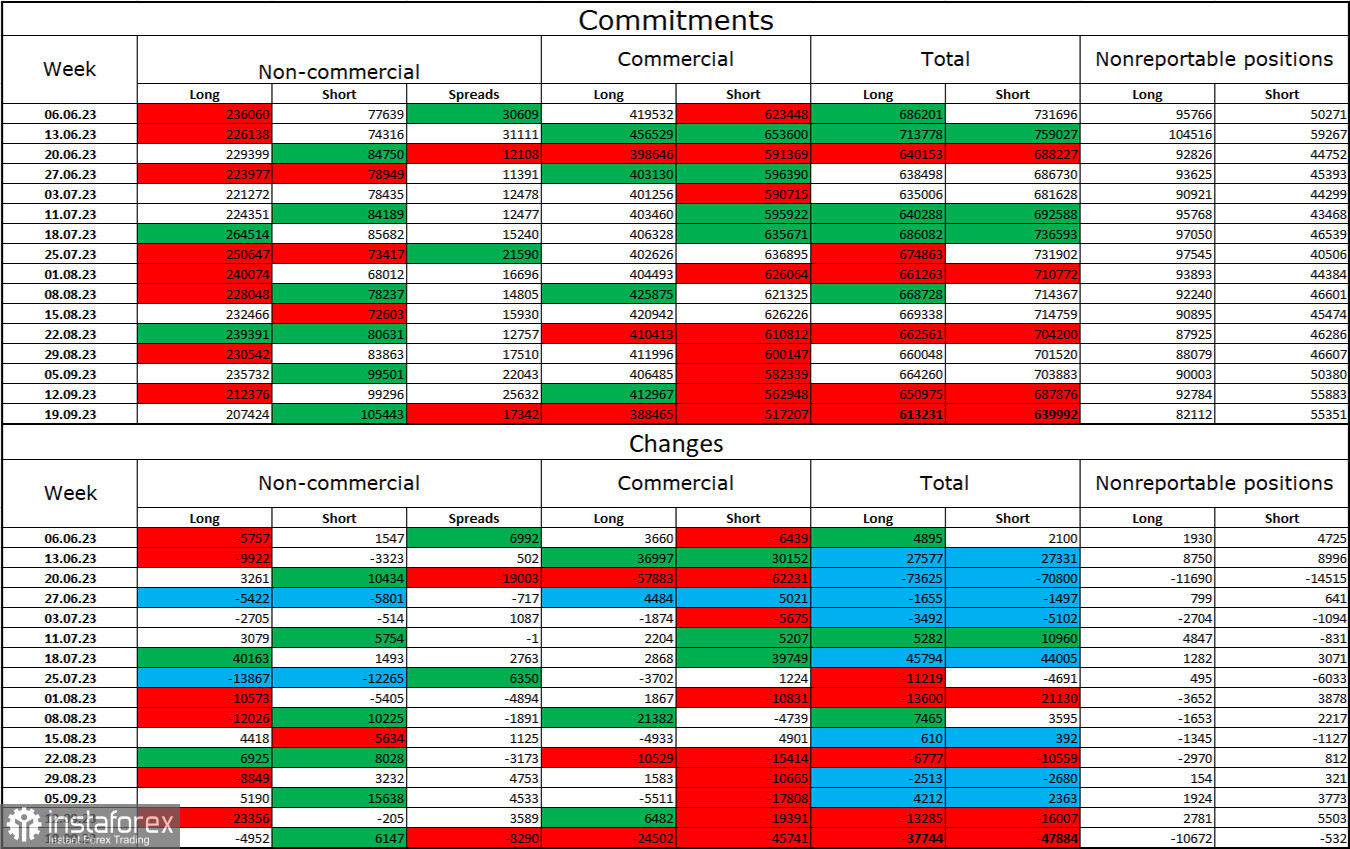
Commitments of Traders (COT) report:

This image is no longer relevant

In the last reporting week, speculators closed 4952 long contracts and opened 6147 short contracts. The sentiment among large traders remains "bullish," but it has noticeably weakened in recent weeks and months. The total number of long contracts held by speculators now stands at 207 thousand, while short contracts amount to 105 thousand. The difference is now only twofold. I believe that the situation will continue to shift in favor of the bears over time. Bulls have dominated the market for too long, and now they need strong news to sustain the "bullish" trend. There is no such news. The high value of open long contracts indicates that professional traders may continue to close them in the near future. I believe that the current figures allow for further declines in the euro in the coming months.

News calendar for the United States and the European Union:

European Union - Change in the number of unemployed in Germany (07:55 UTC).

European Union - Unemployment rate in Germany (07:55 UTC).

European Union - Consumer Price Index (CPI) (09:00 UTC).

USA - Core Personal Consumption Expenditures Price Index (12:30 UTC).

USA - University of Michigan Consumer Sentiment Index (14:00 UTC).

European Union - ECB President Lagarde will deliver a speech (16:00 UTC).

On September 29th, the economic calendar includes numerous important entries, with particular highlights being Lagarde's speech and inflation in the European Union. The impact of the information background on traders' sentiment today can be quite significant.

Forecast for EUR/USD and trader recommendations:

Sales of the pair are possible today if there is a bounce from the 1.0639 level on the 4-hour chart, with targets at 1.0561 and 1.0489. As for buying, we are already a bit late today, but the correction could be strong if there is a close above the 1.0639 level on the 4-hour chart.

Samir Klishi,
الخبير التحليلي لدى شركة إنستافوركس
© 2007-2025
حدد الإطار الزمني
5
د
15
د
30
د
1
س
4
ساعات
1
يوم
1
أسبوع
كسب عائد من تغيرات أسعار العملات المشفرة مع إنستافوركس.
قم بتحميل منصة التداول ميتاتريدر 4 وافتح أول صفقة.
  • Grand Choice
    Contest by
    InstaForex
    InstaForex always strives to help you
    fulfill your biggest dreams.
    انضم إلى المسابقة

المقالات الموصى بها

التوقعات لليورو/الدولار الأمريكي في 13 يونيو 2025

يوم الخميس، واصل زوج اليورو/الدولار الأمريكي حركته الصعودية واستقر فوق مستوى تصحيح فيبوناتشي 100.0% عند 1.1574. ومع ذلك، خلال الليل، حدث انعكاس حاد لصالح الدولار الأمريكي،

Samir Klishi 11:52 2025-06-13 UTC+2

التوقعات لزوج الجنيه الإسترليني/الدولار الأمريكي في 13 يونيو 2025

على الرسم البياني الساعي، ارتد زوج الجنيه الإسترليني/الدولار الأمريكي يوم الخميس من مستوى 1.3520، وارتفع إلى منطقة المقاومة بين 1.3611–1.3620، وارتد منها مرتين، ثم تراجع مرة أخرى إلى مستوى تصحيح

Samir Klishi 11:49 2025-06-13 UTC+2

اليورو/الدولار الأمريكي. 12 يونيو. انتكاسة للدولار

يوم سعيد، أيها المتداولون الأعزاء! واصلت زوج العملات EUR/USD حركته الصعودية يوم الأربعاء بعد الارتداد من منطقة الدعم 1.1374–1.1380. وقد نجح في التماسك فوق مستوى تصحيح فيبوناتشي 76.4% عند 1.1454،

Samir Klishi 10:15 2025-06-12 UTC+2

GBP/USD. 12 يونيو. الاقتصاد البريطاني يتعثر

يوم سعيد، أيها المتداولون الأعزاء! في الرسم البياني الساعي، يوم الأربعاء، انعكس زوج الجنيه الإسترليني/الدولار الأمريكي لصالح الجنيه الإسترليني واستقر فوق مستوى تصحيح فيبوناتشي 161.8% عند 1.3520. يفتح هذا الطريق

Samir Klishi 10:15 2025-06-12 UTC+2

التحليل الفني لحركة السعر اليومية لأداة سلعة النفط الخام، الخميس 12 يونيو 2025.

إذا نظرنا إلى الرسم البياني اليومي لأداة سلعة النفط الخام، يبدو أن هناك تباينًا بين حركة سعر #CL ومؤشر مذبذب ستوكاستيك، وهو مؤشر على أن هناك احتمالًا بأن يواجه #CL

Arief Makmur 08:10 2025-06-12 UTC+2

التحليل الفني لحركة السعر اللحظية لمؤشر Nasdaq 100، الخميس 12 يونيو 2025.

على الرسم البياني لمدة 4 ساعات لمؤشر Nasdaq 100، هناك تباين بين حركة السعر ومؤشر Stochastic Oscillator، خاصة مع التأكيد الحالي لحركة سعر #NDX الذي يتحرك تحت المتوسط المتحرك الأسي

Arief Makmur 08:10 2025-06-12 UTC+2

إشارات التداول لليورو/الدولار الأمريكي للفترة من 12 إلى 19 يونيو 2025: البيع تحت 1.1500 (21 SMA - 8/8 Murray)

إذا انخفض سعر اليورو إلى ما دون 1.1500 في الساعات القادمة، فقد يُعتبر ذلك فرصة للبيع. من الناحية الفنية، يبدو أنه في حالة شراء مفرط على الرسم البياني

Dimitrios Zappas 05:33 2025-06-12 UTC+2

إشارات التداول للذهب (XAU/USD) للفترة من 12 إلى 19 يونيو 2025: البيع تحت مستوى 3,386 دولار (21 SMA - 7/8 Murray)

يبقى الاتجاه الصعودي لزوج XAU/USD قائماً طالما أن السعر يتماسك فوق 3,331. لذلك، سيكون من الحكمة شراء الذهب طالما أن السعر يتماسك فوق 3,359، حيث يقع مستوى 7/8 Murray. ستستمر

Dimitrios Zappas 05:32 2025-06-12 UTC+2

توقعات EUR/USD ليوم 12 يونيو 2025

أثارت بيانات التضخم الأمريكية التي صدرت يوم الأربعاء الأسواق: حيث انخفض مؤشر الدولار بنسبة 0.47%، وارتفع نفط WTI بنسبة 5.54%، وزاد الذهب بنسبة 1.27%، بينما انخفضت عوائد سندات الخزانة الأمريكية

Laurie Bailey 04:40 2025-06-12 UTC+2

توقعات GBP/USD ليوم 12 يونيو 2025

يوم الأربعاء، نجح الجنيه الإسترليني في تجنب الانخفاض إلى ما دون مستويات الدعم الفني، حيث ارتد صعودًا منها. ارتد السعر من خط مؤشر MACD على الرسم البياني اليومي، بينما تحول

Laurie Bailey 04:40 2025-06-12 UTC+2
لا تستطيع التحدث الآن؟
اطرح سؤالك في الدردشة.
Widget callback
 

Dear visitor,

Your IP address shows that you are currently located in the USA. If you are a resident of the United States, you are prohibited from using the services of InstaFintech Group including online trading, online transfers, deposit/withdrawal of funds, etc.

If you think you are seeing this message by mistake and your location is not the US, kindly proceed to the website. Otherwise, you must leave the website in order to comply with government restrictions.

Why does your IP address show your location as the USA?

  • - you are using a VPN provided by a hosting company based in the United States;
  • - your IP does not have proper WHOIS records;
  • - an error occurred in the WHOIS geolocation database.

Please confirm whether you are a US resident or not by clicking the relevant button below. If you choose the wrong option, being a US resident, you will not be able to open an account with InstaForex anyway.

We are sorry for any inconvenience caused by this message.