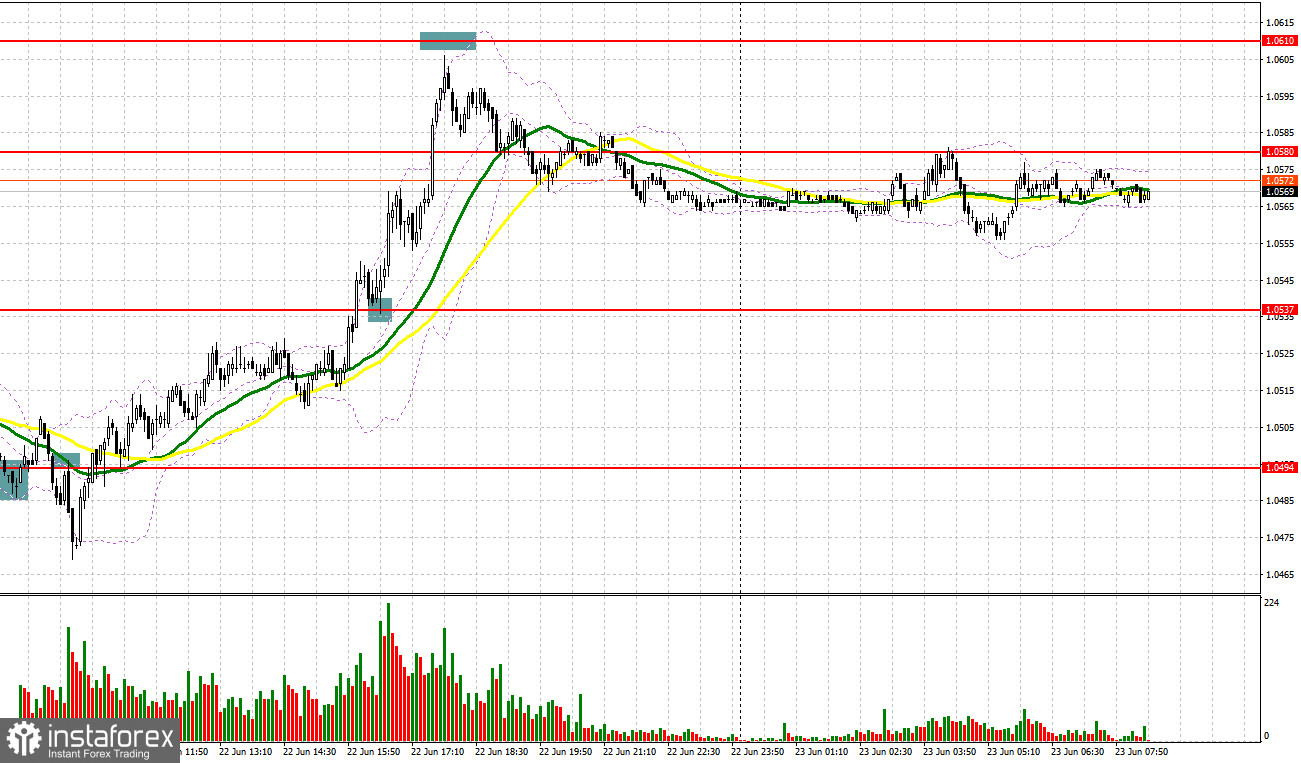
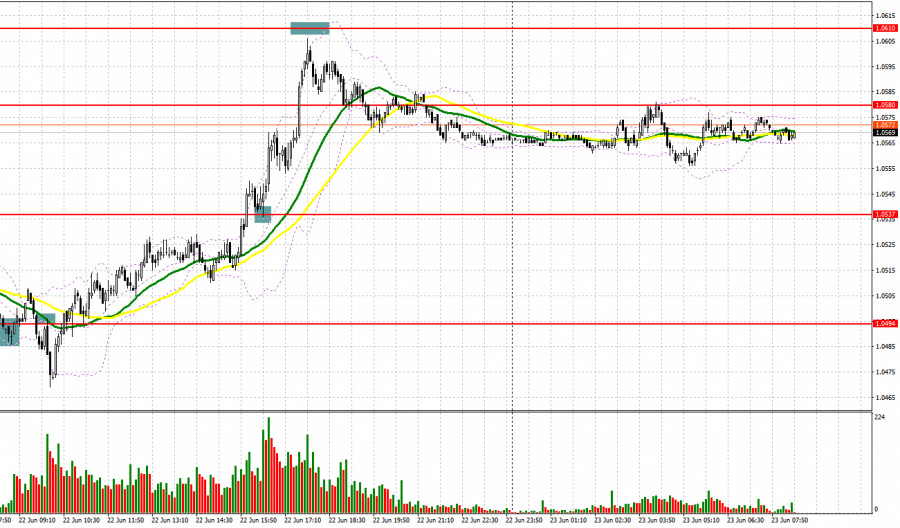
Yesterday, there were a few excellent signals to enter the market. Let's take a look at the 5-minute chart and try to figure out what actually happened. In the morning review, I paid your attention to 1.0494 and recommended making trading decisions with this level in focus. A false breakout in the first half of the day generated a buy signal. However, after 15 pips upwards, the euro came under pressure again that closed positions at break even. A breakout and an opposite test of 1.0494 made up an excellent sell signal before the Fed's policy meeting. Back then, after the price had moved 25 pips down, the bulls managed to push the price back to 1.0494, aiming to updateintraday highs. In the second half of the day before Powell's testimony, the buyers insisted on a breakout and an opposite test of 1.0537. This generated a buy signal. As a result, the euro grew 65 pips. Unfortunately, traders failed to sell the pair at a bounce at 1.0610 because a few pips lacked before its test.
What is needed to open long positions on EUR/USD
The focal point yesterday was Jerome Powell's testimony in front of the Senate Banking Committee in Congress in the second half of the day. In his speech, the Fed's Chair stated that policymakers foresee further rate hikes as such moves are appropriate for the time being. Monetary tightening will allow the central bank to ease the strongest inflationary pressure in the last 40 years. The Fed's leader also supposed that the US economy might slip into recession in the nearest couple of years. He added this scenario could be hardly avoided. His remarks reinforced the euro and weakened the US dollar which comes as no surprise.
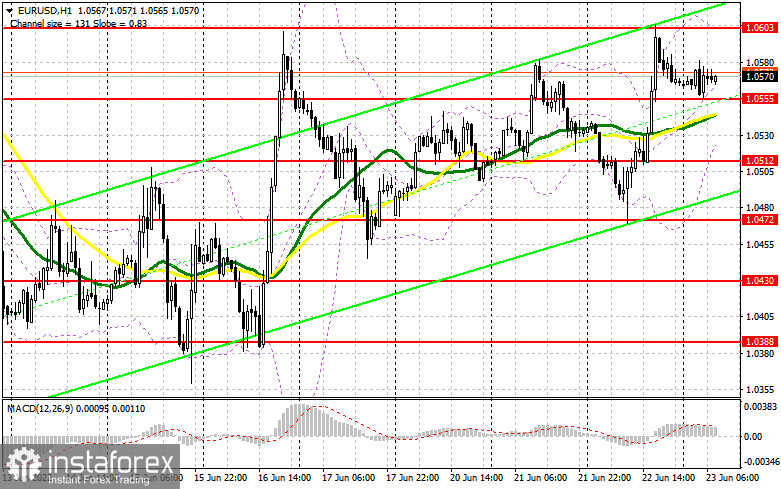
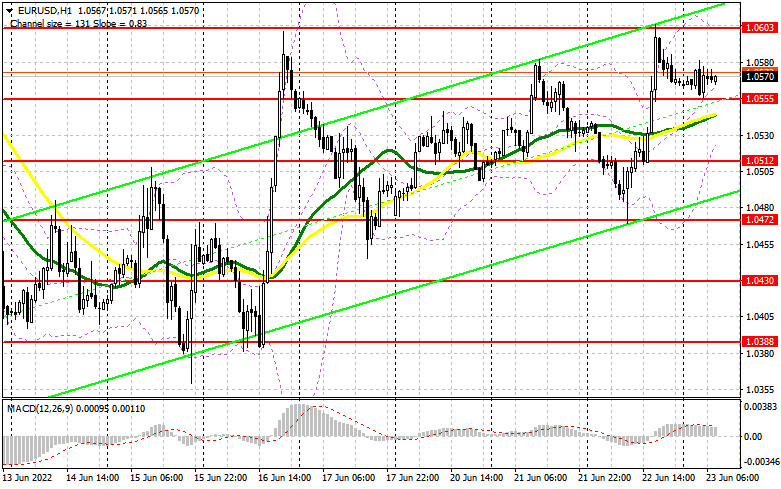
Today the economic calendar reminds us about a series of PMIs by Markit Economics for theEurozone and Germany, including composite PMIs, services and manufacturing PMIs. If the actual data matches expectations or indicates improvement in business activity, the euro will gain ground and update weekly highs. Alternatively, if the currency pair declines following the data release, thekey task for the bulls will be to defend the nearest level of 1.0555. A false breakout there will generate a signal to open long positions with a view to returning to the weekly high at 1.0603. Moving averages are passing at about 1.0555 which also lends a helping hand to the buyers. A breakout and a test of 1.0603 downward will deal a blow to the bears' stop orders. This will allow traders to open long positions with the prospects of building a new uptrend and updating 1.0640. A more distant target is seen at 1.0663 where I recommend profit-taking.
There is nothing wrong if EUR/USD declines and the buyers lack activity at 1.0555. Nevertheless, the pair might get stuck in a range and the bulls will face the challenge of escaping from the sideways channel. In this case, I would recommend you should not rush to enter the market. It would be a good idea to open long positions at a false breakout at about the support level of 1.0512. I would recommend buying EUR/USD immediately at a dip from 1.0472 or from lower levels at 1.0430, bearing in mind a 30-35 pips upward correction intraday.
What is needed to open short positions on EUR/USD
The bears find it more difficult to extend a correction. Indeed, yesterday's update of the weekly high after Powell's testimony proves that the bulls market has been going on since June 15. In case the euro grows in the first half of the day after upbeat PMI reports by Markit, only a false breakout at 1.0603 will generate a signal for opening short positions with the view to returning to support at 1.0555. A breakout and settlement below this level, the ECB economic bulletin, and an opposite test upwards will create an extra sell signal with activation of the buyers' stop orders. In this case, the currency pair might develop a large move towards the area between 1.0512 and the intermediate support level.
A breakout and settlement below 1.0512 pave the way to 1.0472 where I recommend the exit from sell positions. The thing is that we can hardly rely on this scenario because Powell's speech today will be of little importance. The Fed's leader will repeat everything he said yesterday. In case EUR/USD moves upward in the European session and the bears lack activity at 1.0603, I would recommend you cancel short positions until a more attractive level of 1.0640. A false breakoutthere will be a swing high for a downward correction. We can sell EUR/USD immediately at a bounce from 1.0663 or higher from 1.0687, bearing in mind a 30-35 pips correction intraday.
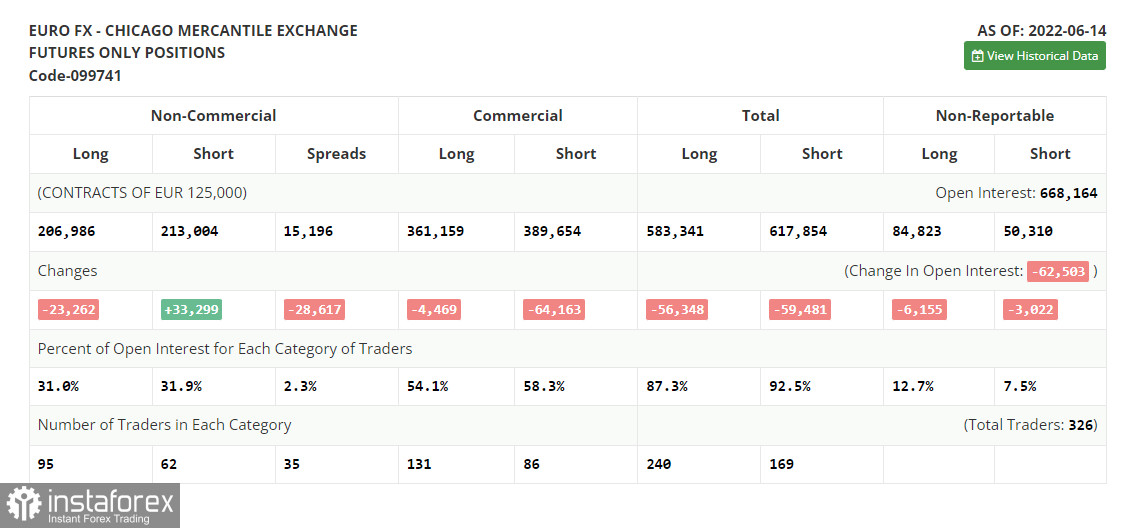
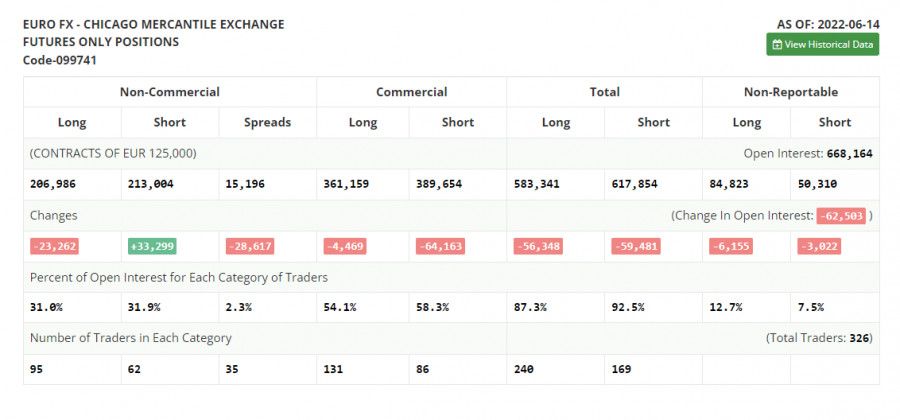
The COT (Commitment of Traders) report from June 14 logs a sharp contraction of long positions and growth of short ones that created a negative delta, thus indicating growing bearish trading sentiment. The ECB decisions had been already digested and the market was mulling over the Fed's policy meeting which ended up with a rate hike by 75 basis points. The regulator underscores its commitment to tough measures against inflation. The fact of aggressive monetary tightening makes traders get rid of risky assets and buy the US dollar. So, the greenback benefits from the Fed's hawkishness. The US dollar is likely to extend its strength thereafter because the Fed is not going to give up its tough measures against soaring inflation. So, further rate hikes will follow. According to the COT report, long non-commercial positions fell by 23,262 to 206,986 whereas short non-commercial positions jumped by 33,299 to 213,004. Despite the low exchangerate, it does not add any appeal to EUR. Thus, traders opt for USD. Last week, the overall non-commercial net positions turned negative and contracted from 50,543 to -6,018. EUR/USD closed lower at 1.0481 last week from 1.0710 a week ago.
Indicators' signals:Trading is carried out above the 30 and 50 daily moving averages. It indicates that thebulls are trying to conquer the market.
Moving averages
Note: The period and prices of moving averages are considered by the author on the H1 hourly chart and differ from the general definition of the classic daily moving averages on the daily D1 chart.
Bollinger BandsIf EUR/USD declines, the indicators' lower border at nearly 1.0525 will serve as support. Alternatively, if the pair rises, the upper border at about 1.0603 will act as resistance.
Description of indicators
Moving average (moving average, determines the current trend by smoothing
out volatility and noise). Period 50. It is marked yellow on the chart. Moving average (moving average, determines the current trend by smoothing out volatility and noise). Period 30. It is marked green on the chart.
MACD indicator (Moving Average Convergence/Divergence — convergence/divergence of moving averages) Quick EMA period 12. Slow EMA period to 26. SMA period 9
Bollinger Bands (Bollinger Bands). Period 20 Non-commercial speculative traders, such as individual traders, hedge funds, and large institutions that use the futures market for speculative purposes and meet certain requirements. Long non-commercial positions represent the total long open position of non-commercial traders. Short non-commercial positions represent the total short open position of non-commercial traders. Total non-commercial net position is the difference between short and long positions of non-commercial traders.