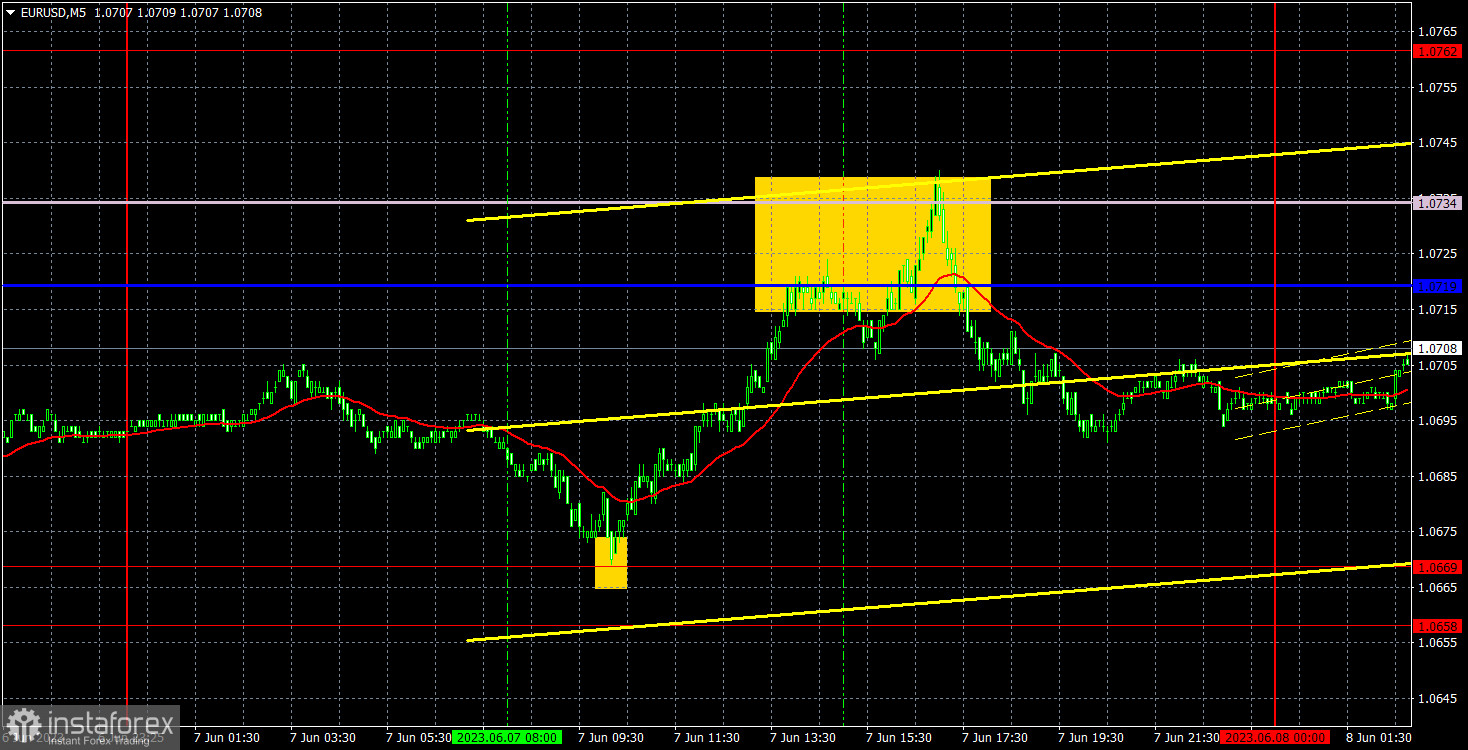
Analysis of EUR/USD 5M.
The EUR/USD pair rose slightly on Wednesday. However, traders should pay attention to another factor. The main thing is the pair slid into the sideways channel which is perfectly visible on the 4-hour chart and even on the 1H chart. The lines of the Ichimoku indicator may intersect with each other in the near future and lose momentum. I will try to adjust them to the previous levels so that they could be of at least some use. Thus, yesterday's rise in the euro was short-lived. It does not mean that an upward trend has begun. The economic calendar was empty yesterday as well as for the week.
However, there were plenty of trading signals. At first, the pair bounced off the 1.0669 level, giving a buy signal. Subsequently, the pair grew to the Senkou Span B line, providing a sell signal. There was also a rebound from the pivot level. It does not matter at which level traders closed their long positions as these two lines should be considered as the trading range. The profit totaled 30 pips. Short positions were also profitable. Traders closed them manually in the evening. The profit amounted to another 10 pips.
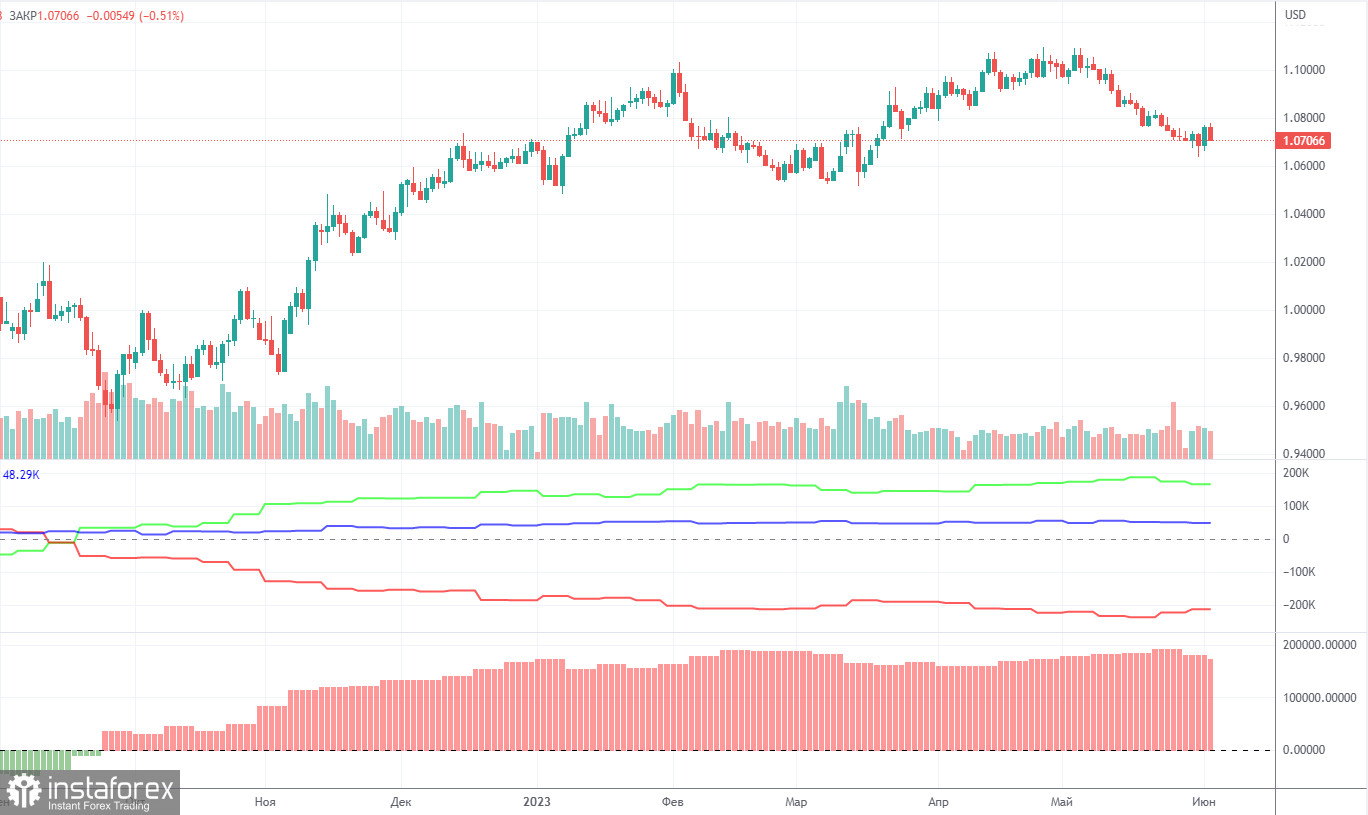
COT report:
On Friday, a new COT report for May 30 was released. In the last 9 months, COT reports have fully corresponded to what is happening on the market. The chart above clearly shows that the net position of big traders (the second indicator) began to grow again in September 2022. At the same time, the euro resumed an upward movement. The net position of non-commercial traders is bullish. The euro is trading at its highs against the US dollar.
I have already mentioned that a fairly high value of the "net position" indicates the end of the uptrend. The first indicator also signals such a possibility as the red and green lines are very far from each other. It often occurs before the end of the trend. The euro tried to start falling a few months ago but there was only a pullback. During the last reporting week, the number of long positions of the "Non-commercial" group of traders decreased by 8,200, and the number of short positions – by 200. The net position tumbled by 8,000. The number of long positions is higher than the number of short ones. Non-commercial traders opened 165,000 long positions. This is a very large gap. The difference is more than three times. The correction has begun. Yet, it may not be a correction but the start of a new downtrend. At this time, it is clear that the pair is likely to resume a downward movement without COT reports.
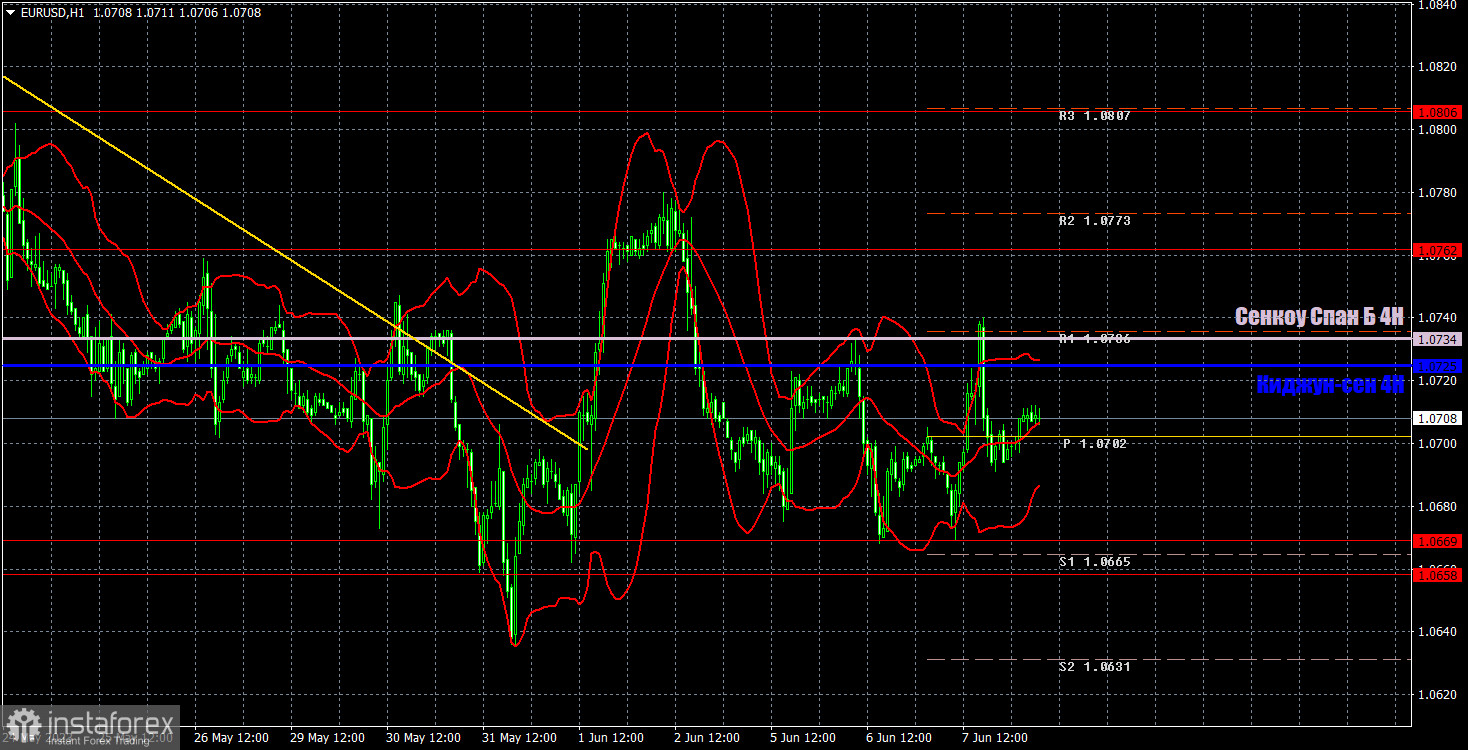
Analysis of EUR/USD 1H.
On the 1H, the pair broke through the descending trend line for the second time. However, it has not climbed from this line yet. A correction is possible. Currently, the price is located below the Senkou Span B and Kijun-sen lines. The pair still has no drivers for growth. Technically, it may continue to adjust this week. Due to the weak fundamental background, the pair could slide into a narrow range.
On June 8, one should pay attention to the following levels: 1.0537, 1.0581, 1.0658-1.0669, 1.0762, 1.0806, 1.0868, 1.0943, 1.1092, as well as the Senkou Span B (1.0734) and Kijun-sen (1.0725) lines. The lines of the Ichimoku indicator can move during the day. Bear it in mind when determining trading signals. There are also support and resistance levels but they do not provide signals, e.g. bounces or breakouts from extreme levels and lines. Do not forget about placing a Stop Loss order at breakeven if the price moves in the right direction by 15 pips. It will you avoid losses if the signal turns out to be false.
Today, the Eurozone's final GDP estimate for the first quarter is on tap. If the figure is not in line with forecasts, the market reaction is unlikely to be strong. The US will release only initial jobless claims. Thus, the euro is likely to keep moving in the sideways channel.
What's on charts:
Support and resistance levels (resistance /support) are thick red lines near which the trend may end. They do not provide trading signals.
The Kijun-sen and Senkou Span B lines are the lines of the Ichimoku indicator plotted to the H1 chart from the 4H one. They are strong lines.
Extreme levels are thin red lines from which the price bounced earlier. They provide trading signals.
Yellow lines are trend lines, trend channels, and any other technical patterns.
Indicator 1 on the COT charts is the net position size of each category of traders.
Indicator 2 on the COT charts is the net position size for the "Non-commercial" group of traders.