empty
08.06.2023 06:37 AM
Analysis of EUR/USD on June 8. EUR slides into narrow range

Analysis of EUR/USD 5M.

This image is no longer relevant

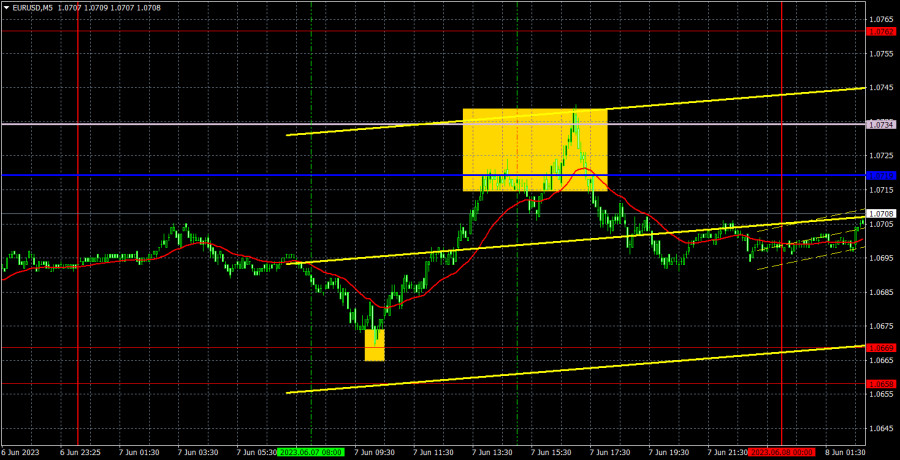
The EUR/USD pair rose slightly on Wednesday. However, traders should pay attention to another factor. The main thing is the pair slid into the sideways channel which is perfectly visible on the 4-hour chart and even on the 1H chart. The lines of the Ichimoku indicator may intersect with each other in the near future and lose momentum. I will try to adjust them to the previous levels so that they could be of at least some use. Thus, yesterday's rise in the euro was short-lived. It does not mean that an upward trend has begun. The economic calendar was empty yesterday as well as for the week.

However, there were plenty of trading signals. At first, the pair bounced off the 1.0669 level, giving a buy signal. Subsequently, the pair grew to the Senkou Span B line, providing a sell signal. There was also a rebound from the pivot level. It does not matter at which level traders closed their long positions as these two lines should be considered as the trading range. The profit totaled 30 pips. Short positions were also profitable. Traders closed them manually in the evening. The profit amounted to another 10 pips.

COT report:

This image is no longer relevant

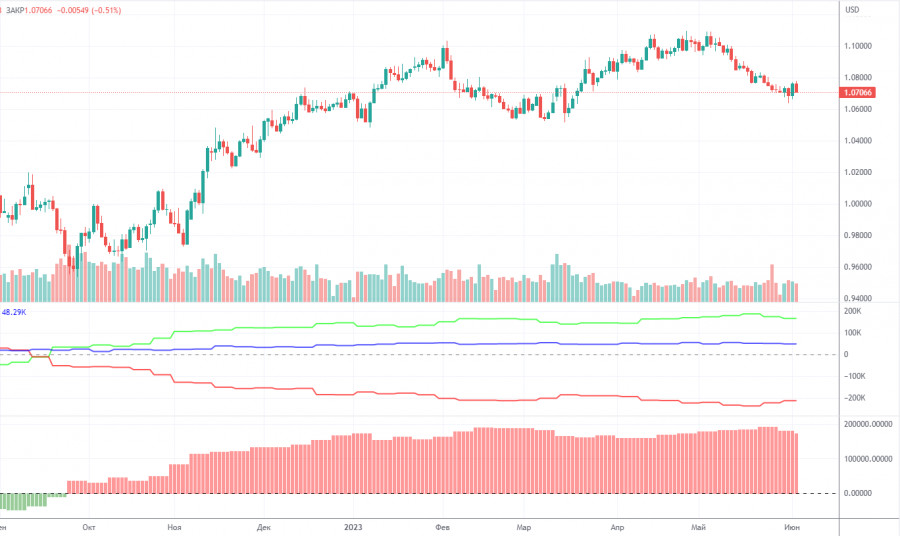
On Friday, a new COT report for May 30 was released. In the last 9 months, COT reports have fully corresponded to what is happening on the market. The chart above clearly shows that the net position of big traders (the second indicator) began to grow again in September 2022. At the same time, the euro resumed an upward movement. The net position of non-commercial traders is bullish. The euro is trading at its highs against the US dollar.

I have already mentioned that a fairly high value of the "net position" indicates the end of the uptrend. The first indicator also signals such a possibility as the red and green lines are very far from each other. It often occurs before the end of the trend. The euro tried to start falling a few months ago but there was only a pullback. During the last reporting week, the number of long positions of the "Non-commercial" group of traders decreased by 8,200, and the number of short positions – by 200. The net position tumbled by 8,000. The number of long positions is higher than the number of short ones. Non-commercial traders opened 165,000 long positions. This is a very large gap. The difference is more than three times. The correction has begun. Yet, it may not be a correction but the start of a new downtrend. At this time, it is clear that the pair is likely to resume a downward movement without COT reports.

Analysis of EUR/USD 1H.

This image is no longer relevant

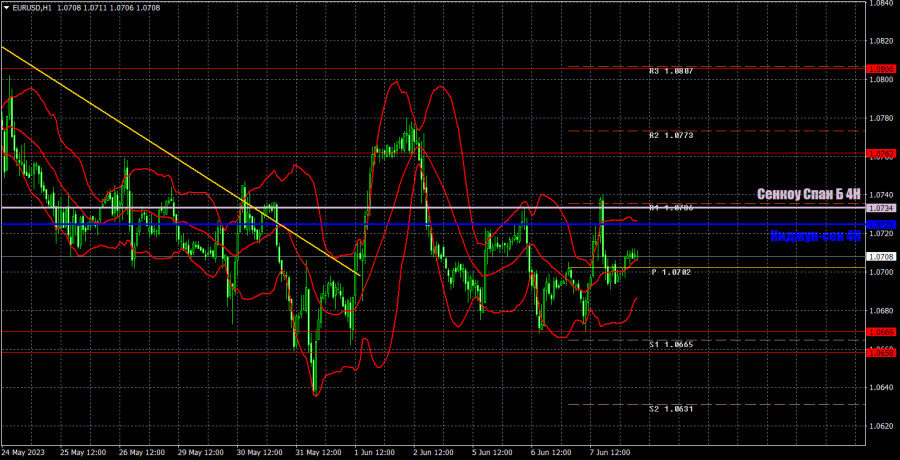
On the 1H, the pair broke through the descending trend line for the second time. However, it has not climbed from this line yet. A correction is possible. Currently, the price is located below the Senkou Span B and Kijun-sen lines. The pair still has no drivers for growth. Technically, it may continue to adjust this week. Due to the weak fundamental background, the pair could slide into a narrow range.

On June 8, one should pay attention to the following levels: 1.0537, 1.0581, 1.0658-1.0669, 1.0762, 1.0806, 1.0868, 1.0943, 1.1092, as well as the Senkou Span B (1.0734) and Kijun-sen (1.0725) lines. The lines of the Ichimoku indicator can move during the day. Bear it in mind when determining trading signals. There are also support and resistance levels but they do not provide signals, e.g. bounces or breakouts from extreme levels and lines. Do not forget about placing a Stop Loss order at breakeven if the price moves in the right direction by 15 pips. It will you avoid losses if the signal turns out to be false.

Today, the Eurozone's final GDP estimate for the first quarter is on tap. If the figure is not in line with forecasts, the market reaction is unlikely to be strong. The US will release only initial jobless claims. Thus, the euro is likely to keep moving in the sideways channel.

What's on charts:

Support and resistance levels (resistance /support) are thick red lines near which the trend may end. They do not provide trading signals.

The Kijun-sen and Senkou Span B lines are the lines of the Ichimoku indicator plotted to the H1 chart from the 4H one. They are strong lines.

Extreme levels are thin red lines from which the price bounced earlier. They provide trading signals.

Yellow lines are trend lines, trend channels, and any other technical patterns.

Indicator 1 on the COT charts is the net position size of each category of traders.

Indicator 2 on the COT charts is the net position size for the "Non-commercial" group of traders.

Paolo Greco,
Analytical expert of InstaForex
© 2007-2025
Select timeframe
5
min
15
min
30
min
1
hour
4
hours
1
day
1
week
Earn on cryptocurrency rate changes with InstaForex
Download MetaTrader 4 and open your first trade
  • Grand Choice
    Contest by
    InstaForex
    InstaForex always strives to help you
    fulfill your biggest dreams.
    JOIN CONTEST

Recommended Stories

How to Trade the EUR/USD Pair on May 19? Simple Tips and Trade Analysis for Beginners

Analysis of Friday's Trades 1H Chart of EUR/USD On Friday, the EUR/USD currency pair declined significantly in price, despite no macroeconomic or fundamental reasons. However, the downward trend

Paolo Greco 08:19 2025-05-19 UTC+2

Trading Recommendations and Analysis for GBP/USD on May 19: The Pound Feels Comfortable in a Flat Market

On Friday, the GBP/USD currency pair mainly traded downward throughout the day but closed with only a minor decline. This was mostly because the dollar weakened during the Asian session

Paolo Greco 04:42 2025-05-19 UTC+2

Trading Recommendations and Analysis for EUR/USD on May 19: The Dollar Struggles to Grow, but Still Does

The EUR/USD currency pair showed a slight decline on Friday. Although the 5-minute chart might suggest the pair spent the entire day in a downtrend, the U.S. dollar gained only

Paolo Greco 04:42 2025-05-19 UTC+2

How to Trade the GBP/USD Pair on May 19? Simple Tips and Trade Analysis for Beginners

Analysis of Friday's Trades 1H Chart of GBP/USD On Friday, the GBP/USD pair also traded lower, although there were no objective reasons. While the euro maintains a downward trend

Paolo Greco 00:35 2025-05-19 UTC+2

How to Trade the GBP/USD Pair on May 16? Simple Tips and Trade Analysis for Beginners

Analysis of Thursday's Trades 1H Chart of GBP/USD On Thursday, the GBP/USD pair showed minimal upward movement; however, the 5-minute timeframe indicates this was largely a sideways move

Paolo Greco 06:17 2025-05-16 UTC+2

How to Trade the EUR/USD Pair on May 16? Simple Tips and Trade Analysis for Beginners

Analysis of Thursday's Trades 1H Chart of EUR/USD The EUR/USD currency pair traded in both directions throughout Thursday. The macroeconomic background was rich, but it had no decisive impact

Paolo Greco 06:17 2025-05-16 UTC+2

Trading Recommendations and Analysis for GBP/USD on May 16: The Pound Decided to Take a Break

On Thursday, the GBP/USD currency pair traded strictly sideways with low volatility. Despite a busy macroeconomic calendar, the market ignored most of the data, just as anticipated

Paolo Greco 03:54 2025-05-16 UTC+2

Trading Recommendations and Analysis for EUR/USD on May 16: The Market Has Once Again Confirmed the Obvious

On Thursday, the EUR/USD currency pair showed only one thing—a complete unwillingness to move. We observed sideways movement throughout the day despite a fairly packed macroeconomic calendar. However, as mentioned

Paolo Greco 03:54 2025-05-16 UTC+2

How to Trade the GBP/USD Pair on May 15? Simple Tips and Trade Analysis for Beginners

Analysis of Wednesday's Trades 1H Chart of GBP/USD The GBP/USD pair continued its upward movement throughout Wednesday, despite the absence of any specific fundamental reasons. The day before, a U.S

Paolo Greco 06:21 2025-05-15 UTC+2

How to Trade the EUR/USD Pair on May 15? Simple Tips and Trade Analysis for Beginners

Analysis of Wednesday's Trades 1H Chart of EUR/USD The EUR/USD currency pair experienced upward movement for approximately half of Wednesday. The latest "surge" in the euro was particularly "impressive," although

Paolo Greco 06:21 2025-05-15 UTC+2
Can't speak right now?
Ask your question in the chat.
Widget callback
 

Dear visitor,

Your IP address shows that you are currently located in the USA. If you are a resident of the United States, you are prohibited from using the services of InstaFintech Group including online trading, online transfers, deposit/withdrawal of funds, etc.

If you think you are seeing this message by mistake and your location is not the US, kindly proceed to the website. Otherwise, you must leave the website in order to comply with government restrictions.

Why does your IP address show your location as the USA?

  • - you are using a VPN provided by a hosting company based in the United States;
  • - your IP does not have proper WHOIS records;
  • - an error occurred in the WHOIS geolocation database.

Please confirm whether you are a US resident or not by clicking the relevant button below. If you choose the wrong option, being a US resident, you will not be able to open an account with InstaForex anyway.

We are sorry for any inconvenience caused by this message.