empty
22.10.2019 12:49 AM
EUR/USD. October 21. Results of the day. Euro shows readiness to go into a correction after several weeks of growth

4-hour timeframe

This image is no longer relevant

Amplitude of the last 5 days (high-low): 30p - 55p - 64p - 75p - 56p.

Average volatility over the past 5 days: 56p (average).

The first trading day of the week for the EUR/USD pair was held in absolutely neutral trading without strong exchange rate changes. The pair only began to decline during the US trading session, which could develop into a downward correction. Unfortunately, no important and interesting macroeconomic reports and other news were available to traders today. Thus, market participants were deprived of fundamental influence. Brexit, which miraculously began to influence the movement of the euro/dollar pair in the last week, can once again be put on hold. The trade war between the United States and the European Union seems to be paused before it even begins. In such a situation, traders can only think about what will happen this Thursday, and whether something will happen at all. Recall that this day is the only one this week when there will be important macroeconomic events. The ECB meeting with the announcement of the results and press conference of Mario Draghi, indexes of business activity in the services and manufacturing sectors of the US and Europe, orders for durable goods in the US.

Apart from this list, of course, is the ECB meeting, the last ECB meeting for Mario Draghi. However, firstly, he still has two days to go. Secondly, judging by analyst forecasts, this time no changes in the monetary policy of the European Union will follow. The Federal Reserve will hold a meeting next, next week, where changes in monetary policy may just follow, namely the third consecutive reduction in the key rate. If this happens, the imbalance between the Fed and the ECB rates will continue to decline, which will definitely be in favor of the euro. The faster the difference in rates decreases, the more chances the euro has on the formation of a full-fledged upward trend. At the moment, despite several weeks of euro growth, it is impossible to say that the hegemony of the US dollar is complete.

We believe that the EUR/USD pair will be prone to a downward correction until Thursday, despite any news regarding Brexit. The last week, when there was a correlation between the pound and the dollar, we consider to some extent an accident. Thus, in order to continue strengthening, the euro needs new fundamental foundations. At least some hint of stabilization of the situation in the eurozone by Mario Draghi, improving business activity indexes in the EU, rising wages and retail sales. If this does not happen, then it will be difficult for the euro to continue to show growth against the dollar.

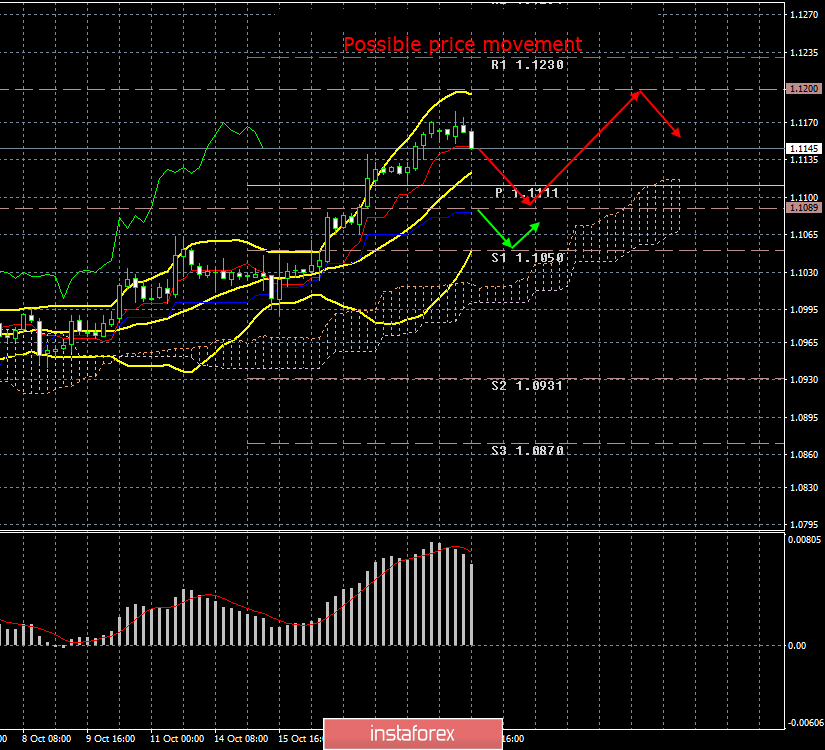
From a technical point of view, the MACD indicator shows that a downward correction has already begun. Thus, the immediate goal for this correction is the Kijun-sen line, which is located near the level of 1.1089, built on the basis of the average volatility of the currency pair. By the way, if the pound shows just fantastic volatility, then the euro is quite mediocre. 56 points a day is not much. The difference in the movements of the two main pairs remains quite high, from our point of view.

Trading recommendations:

EUR/USD may begin to adjust. Thus, traders are advised to wait until the completion of the current correction and only after that resume trading on the increase with the goals of 1.1200 and 1.1230. It is recommended to return to euro sales not earlier than when the bears overcome the critical line of Kijun-sen, which will be the first signal of a change in trend.

In addition to the technical picture, fundamental data and the time of their release should also be taken into account.

Explanation of the illustration:

Ichimoku indicator:

Tenkan-sen is the red line.

Kijun-sen is the blue line.

Senkou Span A - light brown dotted line.

Senkou Span B - light purple dashed line.

Chikou Span - green line.

Bollinger Bands Indicator:

3 yellow lines.

MACD indicator:

Red line and bar graph with white bars in the indicator window.

Paolo Greco,
ผู้เชี่ยวชาญด้านการวิเคราะห์ของ InstaForex
© 2007-2025
เลือกช่วงเวลา
5
นาที
15
นาที
30
นาที
1
ชั่วโมง
4
ชั่วโมง
1
วัน
1
สัปดาห์
รับผลกำไรจากการเปลี่ยนแปลงอัตราสกุลเงินดิจิทัลกับ InstaForex.
ดาวน์โหลด MetaTrader 4 และเปิดการซื้อขายครั้งแรกของคุณ.
USD/CAD: การวิเคราะห์และการพยากรณ์ คู่เงิน USD/CAD กำลังแสดงการฟื้นตัวเล็กน้อยจากระดับที่ต่ำกว่า 1.3600 โดยย้อนไปเกือบทั้งหมดของการสูญเสียในวันที่ผ่านมา โดยได้รับการสนับสนุนจากการฟื้นตัวของดอลลาร์สหรัฐ นอกจากนี้ ความกังวลเกี่ยวกับการหยุดชะงักในการจัดหาน้ำมันในตะวันออกกลางกำลังผลักดันราคาน้ำมันดิบให้พุ่งขึ้นอย่างรวดเร็ว ทำให้ราคาของน้ำมันแตะระดับสูงสุดในรอบห้าเดือน เนื่องจากเงินดอลลาร์แคนาดาเป็นสกุลเงินที่เชื่อมโยงกับสินค้าโภคภัณฑ์ ราคาน้ำมันจึงส่งผลต่อค่าของมันเป็นอย่างมาก ประกอบกับความเป็นไปได้ที่ลดลงของการปรับลดอัตราดอกเบี้ยเพิ่มเติมจากธนาคารกลางแคนาดาและความคาดหวังต่อข้อตกลงการค้าระหว่างสหรัฐอเมริกาและแคนาดา ปัจจัยเหล่านี้ช่วยสนับสนุนเงินดอลลาร์แคนาดา โอกาสทางการค้าที่ดีขึ้นและนโยบายการเงินของแคนาดาที่มีเสถียรภาพอาจช่วยให้
  • Grand Choice
    Contest by
    InstaForex
    InstaForex always strives to help you
    fulfill your biggest dreams.
    เข้าร่วมการแข่งขัน


บทความแนะนำ

วิเคราะห์ตัวบอกสถานการณ์เมษายน 30, 2023 ของตัวบอกเมฆอิจิโคโมคานะสำหรับทองคำ

ราคาทองคำกำลังซื้อขายอยู่ในระดับ 2,034 ดอลลาร์ แนวโน้มระยะสั้นตามตัวชี้วัดคลาวด์ Ichimoku ในกราฟวันแสดงอยู่ในทิศทางขาขึ้น ราคาอยู่บน Kumo (คลาวด์) อย่างชัดเจนและยังไม่มีสัญญาณศักดิ์สิทธิ์ในการเปลี่ยนแนว ราคายังอยู่เหนือเส้นคิเจงเซ็น (ตัวบ่งชี้สีเหลือง) และเส้นเท็นกังเซ็น (ตัวบ่งชี้สีแดง) ตัวบ่งชี้เหล่านี้จะช่วยสนับสนุนที่ราคา

Alexandros Yfantis 21:52 2023-11-30 UTC+2

การวิเคราะห์ตัวบ่งชี้เมฆ Ichimoku บน EURUSD สำหรับวันที่ 29 พฤศจิกายน พ.ศ. 2566

EURUSD กำลังซื้อขายในระดับประมาณ 1.0980 ในทางเทคนิคของเมฆอิจิโมกุ แนวโน้มยังคงเป็นเช่นเดิม EURUSD มีระดับสูงสุดที่ 1.1017และเริ่มลดลงเพื่อทดสอบระดับสนับสนุนของเส้น tenkan-sen (ตัวบ่งชี้สีแดง)ที่ 1.0976 เส้น kijun-sen (ตัวบ่งชี้สีเหลือง)มีความสามารถในการสนับสนุนที่ 1.0952

Alexandros Yfantis 13:33 2023-11-29 UTC+2

การวิเคราะห์ตัวบ่งชี้เมฆอิชิโมกุเกี่ยวกับ EURUSD ในวันที่ 28 พฤศจิกายน พ.ศ. 2566

EURUSD กำลังซื้อขายรอบ 1.0950 ในทางเทคนิครูปแบบเมฆ Ichimoku ในกราฟ 4 ชั่วโมง แนวโน้มยังคงเป็นแบบข้างขึ้น เนื่องจากราคายังคงอยู่เหนือเมฆ (cloud) ได้ตลอดเวลา จุด Chikou (เส้นดำแสดงตัวบ่งชี้)

Alexandros Yfantis 14:41 2023-11-28 UTC+2

การวิเคราะห์ตัวชี้วัดเมฆอิชิโมกุในหุ้น USDJPY สำหรับวันที่ 28 พฤศจิกายน 2566

USDJPY กำลังซื้อขายรอบ 148.43 ในเชิงกลุ่มตะกอนอิจิโมกุ แสดงให้เห็นถึงความผันผวนกลางอยู่ในตอนนี้เนื่องจากราคาเข้าสู่คำโมกุประจำวัน (คลาวด์) ซึ่งแสดงถึงอาการอ่อนแอ ราคาไม่สามารถขึ้นเหนือเส้นเท็งคัน (สถานีสีแดง) และเส้นเคียวนคัน (สิ่งบ่งชี้สีเหลือง) แต่ในทางกลับกันราคาปิดต่ำกว่าขอบเขตคลาวด์บนเมื่อวานนี้ ส่วนตรงสาย Chikou (สถานีสีดำ)

Alexandros Yfantis 14:37 2023-11-28 UTC+2

การวิเคราะห์ดัชนีเมฆอิชิโมกุบนทองคำ สำหรับวันที่ 27 พฤศจิกายน พ.ศ. 2566

ราคาทองคำกำลังซื้อขายข้างบน $2,010 และกำลังสร้างสูงขึ้นเมื่อเทียบกับสูงในเดือนตุลาคม ในมุมมองของเมฆอิชิโมกุ แนวโน้มยังคงเป็นแบบบูรณาการ ราคาทองคำอยู่เหนือ Kumo (เมฆ) แท่งแดงอินดิเคเตอร์ระดับ Tenkan-sen และแท่งเหลืองอินดิเคเตอร์ระดับ Kijun-sen ทั้งสองอยู่ต่ำกว่าราคาปัจจุบันเป็น Chikou span

Alexandros Yfantis 14:57 2023-11-27 UTC+2

การวิเคราะห์ตัวช่วยอินดิเคเตอร์ Ichimoku cloud บน EURUSD สำหรับวันที่ 27 พฤศจิกายน ค.ศ. 2023

EURUSD กำลังซื้อขายอยู่ในระดับประมาณ 1.0950 ในแผนภูมิ 4 ชั่วโมงราคาก็ยังซื้ออยู่ด้านบนไอคิมอกุ คลาวด์ (มีแนวโน้มขาขึ้น) ขณะที่เชิงกายาณศิลป์ (เส้นดำ) ยังอยู่ด้านบนรูปแบบกระเสียบหรือก้านเทียนเทียน (มีแนวโน้มขาขึ้น) ในขณะเดียวกัน เท้าเข็มสีแดง (เส้นแดง)

Alexandros Yfantis 14:53 2023-11-27 UTC+2

การวิเคราะห์ตัวบ่งชี้เมฆอิชิโมกุด้าน USDJPY ในวันที่ 27 พฤศจิกายน พ.ศ. 2566

USDJPY กำลังซื้อขายอยู่ที่ราคาประมาณ 148.80 เจนนี้ ราคาในวันนี้อยู่ใกล้ๆ จุดเข้าสู่คลาวด์รายวัน (Daily Kumo) ซึ่งอาจทำให้เกิดการเปลี่ยนแนวโน้มจากตลาดแบบตัวขีดเขียนให้กลายเป็นภาวะเป็นระดับกลาง ราคาถูกเตียงรองคลาวด์และทดสอบเส้นเท็งคานเซ็น (เส้นสีแดง) และเส้นคิจุนเซ็น (เส้นสีเหลือง) USDJPY ถูกปฏิเสธที่เส้นต้านและขณะนี้กำลังเคลื่อนลงอีกครั้ง

Alexandros Yfantis 14:49 2023-11-27 UTC+2

การวิเคราะห์ตัวบ่งชี้เมฆอิชิโมกุใน Gold สำหรับวันที่ 24 พฤศจิกายน พ.ศ. 2566

ราคาทองคำกำลังซื้อขายอีกครั้งรอบรอบ 2,000 ดอลลาร์ แนวโน้มราคาในระยะสั้นยังคงเป็นแนวโน้มขาขึ้นเนื่องจากราคายังคงอยู่เหนือระดับสนับสนุนของ Kumo (เมฆ) สนธิต Chikou (ตัวชี้วัดเส้นดำ) ยังคงอยู่เหนือรูปแท่งเทียน (เป็นแนวโน้มขาขึ้น) ราคายังคงอยู่เหนือเส้นเท็คันเซน (เส้นสีแดง) และเส้นคิจุนเซน (เส้นสีเหลือง)

Alexandros Yfantis 16:27 2023-11-24 UTC+2

การวิเคราะห์ตัวบ่งชี้เมฆอีจิโมกุบนคู่สกุลเงิน EURUSD สำหรับวันที่ 24 พฤศจิกายน พ.ศ. 2566

EURUSD กำลังซื้อขายอยู่ที่ราวๆ 1.0936 ในเชิงฝนคลาวด์อิชิโมกู, แนวโน้มยังคงเป็นแบบการเงินในระยะสั้นๆ ตามที่ราคายังคงซื้อขายอยู่เหนือคลาวด์ (เมฆ) สแปนของ Chikou (สายตัวชี้วัดสีดำ) ยังคงอยู่เหนือรูปแบบแท่งเทียน (ลักษณะการเงินที่ดี) โทเคนเส็น (สายตัวชี้แดง) และคีจันเส็น

Alexandros Yfantis 16:24 2023-11-24 UTC+2

วิเคราะห์ตัวชี้วัดเมฆอิชิโมกุใน USDJPY สำหรับวันที่ 23 พฤศจิกายน พ.ศ. 2566

USDJPY กำลังซื้อขายรอบ 149.62 ราคาถอนกลับมาใกล้ Kumo รายวัน (เมฆ) และพบการสนับสนุน ปัจจุบันราคากำลังกระเด็นกลับขึ้นสู่ kijun-sen (เส้นสีเหลืองตัวชี้วัด) และ tenkan-sen (เส้นสีแดงตัวชี้วัด) ทั้งสองตัวชี้วัดพบรอบ

Alexandros Yfantis 16:21 2023-11-23 UTC+2
หากไม่สะดวกคุยในตอนนี้
ระบุคำถามไว้ได้ใน แชท.
Widget callback
 

Dear visitor,

Your IP address shows that you are currently located in the USA. If you are a resident of the United States, you are prohibited from using the services of InstaFintech Group including online trading, online transfers, deposit/withdrawal of funds, etc.

If you think you are seeing this message by mistake and your location is not the US, kindly proceed to the website. Otherwise, you must leave the website in order to comply with government restrictions.

Why does your IP address show your location as the USA?

  • - you are using a VPN provided by a hosting company based in the United States;
  • - your IP does not have proper WHOIS records;
  • - an error occurred in the WHOIS geolocation database.

Please confirm whether you are a US resident or not by clicking the relevant button below. If you choose the wrong option, being a US resident, you will not be able to open an account with InstaForex anyway.

We are sorry for any inconvenience caused by this message.