empty
25.11.2021 04:50 AM
Forecast and trading signals for GBP/USD for November 25. Detailed analysis of the movement of the pair and trade deals. The pound does not really want to fall, but follows the euro currency

GBP/USD 5M

This image is no longer relevant

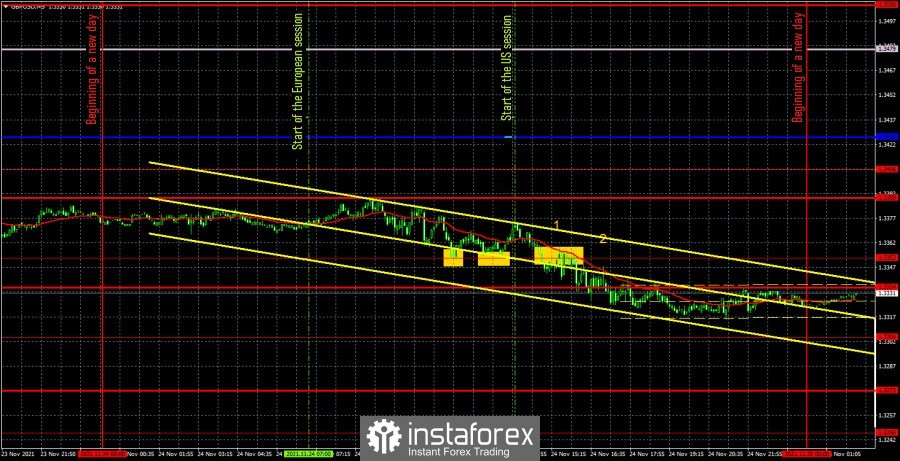
The GBP/USD pair continued to trade absolutely indistinctly, but at the same time maintained a downward trend. Pay attention to the chart above, which clearly shows the intraday movement of the pair. Every 20 points down, there was a 15-point retracement upward. Volatility, as for the pound/dollar pair, was low on Wednesday - only 66 points. There was a downward movement, but very weak, and all trading signals formed only around one extreme level 1.3352. And since there were more than one signals, these are actually signs of a flat, not a trend movement. In general, it was very inconvenient to trade, in contrast to the previous day. It should also be noted right away that there was not a single macroeconomic report or other important event in the UK yesterday. The numbers "1" and "2" in the chart mark the time when macroeconomic statistics in the United States was published, which practically had no effect on the pair's movement and which we talked about in our review on the euro/dollar. We can single out only reports on GDP (+ 2.1% q/q vs. forecast + 2.2% q/q) and on orders for durable goods (-0.5% m/m vs. forecast + 0.2% m/m). It turns out that both of the most important reports were not in favor of the US currency, but nevertheless, they did not stop its strengthening. Now let's move on to examining trading signals. The first two trading signals can be considered together as they were identical. Rebounds from the 1.3352 level, which should have been worked out with a long position. The pair could not go up either after the first or after the second 20 points, so Stop Loss was not set to breakeven. A long position was manually closed when the pair settled below 1.3352 and thus formed a sell signal. It should also have been worked out, but with a short position. The deal turned out to be more successful than the first one and brought about 16 points of profit - it should have been manually closed in the late afternoon. A loss of 12 points was received on the first trade.

GBP/USD 1H
This image is no longer relevant

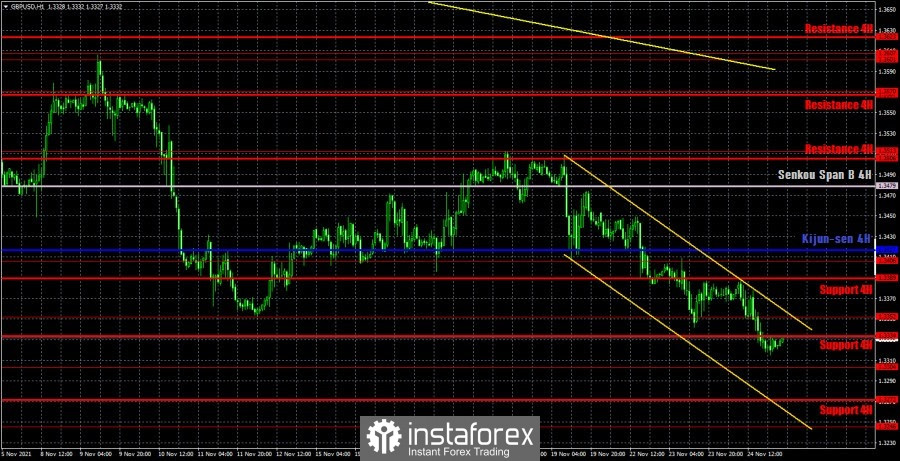
On the hourly timeframe, the pound/dollar pair continues its downward movement, and in addition to the downward trend line, a downward trend channel has also formed, which has a larger slope. Thus, despite all the nondescript movements on the 5-minute TF, the movement looks very good on the higher TFs. If we take into account the 4-hour TF, then it is now very good to trade there, as it assumes a longer-term holding of positions than intraday. We distinguish the following important levels on November 25: 1.3246, 1.3304, 1.3352, 1.3406, 1.3513. Senkou Span B (1.3479) and Kijun-sen (1.3417) lines can also be signal sources. Signals can be "rebounds" and "breakthroughs" of these levels and lines. It is recommended to set the Stop Loss level at breakeven when the price passes 20 points in the right direction. The Ichimoku indicator lines can move during the day, which should be taken into account when looking for trading signals. Bank of England Governor Andrew Bailey will speak in the UK on Thursday, which is unlikely to be of any interest to the markets. It should be remembered that not every speech by the head of the central bank provokes at least some kind of reaction, and not every speech gives the markets important information. Apart from Bailey's speech, there won't be any other big events tonight.

We recommend you to familiarize yourself:

Overview of the EUR/USD pair. November 25. "Coronavirus" swept over Germany. The locomotive of the European economy may stop...

Overview of the GBP/USD pair. November 25. A year has passed. The UK and EU are still in talks. The rhetoric of Maros Sefcovic does not change.

Forecast and trading signals for EUR/USD for November 25. Detailed analysis of the movement of the pair and trade deals.

COT report
This image is no longer relevant

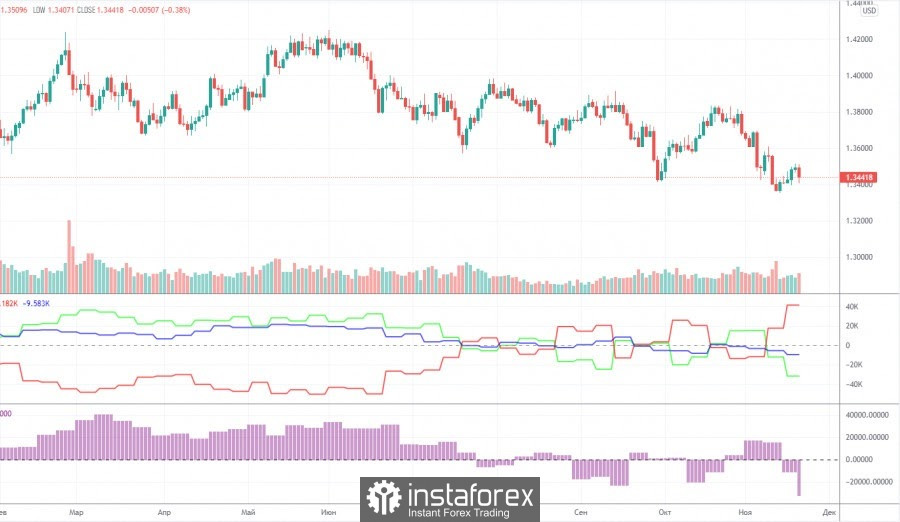
The mood of professional traders became much more bearish during the last reporting week. However, this should not be surprising, since the mood of major players has been constantly changing over the past few months, which perfectly reflects the first indicator in the chart above. The green and red lines, which indicate the net positions (in other words, the mood) of non-commercial and commercial traders, constantly change the direction of movement and constantly change their position relative to the zero level. The last reporting week only confirmed us in these conclusions. The green line has dropped significantly again, and the red line has increased significantly, although a couple of weeks ago it was the opposite. Thus, formally, the mood of professional traders has become more bearish, but in reality it changes every couple of weeks, so it is impossible to make a long-term conclusion. The non-commercial group closed 4,000 buy contracts (longs) and opened 17,000 sell contracts (shorts) during the reporting week. Thus, the net position decreased by 21,000 contracts at once, which is a lot for the pound. However, this does not matter much, since the net position of non-commercial traders also constantly jumps up and down, which is eloquently signaled by the second indicator in the chart above. It should also be noted that in the long term, the pound/dollar exchange rate itself also constantly jumps up and down. Thus, it is not possible to make a long-term forecast based on COT reports.

Explanations for the chart:

Support and Resistance Levels are the levels that serve as targets when buying or selling the pair. You can place Take Profit near these levels.

Kijun-sen and Senkou Span B lines are lines of the Ichimoku indicator transferred to the hourly timeframe from the 4-hour one.

Support and resistance areas are areas from which the price has repeatedly rebounded off.

Yellow lines are trend lines, trend channels and any other technical patterns.

Indicator 1 on the COT charts is the size of the net position of each category of traders.

Indicator 2 on the COT charts is the size of the net position for the non-commercial group.

Paolo Greco,
ผู้เชี่ยวชาญด้านการวิเคราะห์ของ InstaForex
© 2007-2025
เลือกช่วงเวลา
5
นาที
15
นาที
30
นาที
1
ชั่วโมง
4
ชั่วโมง
1
วัน
1
สัปดาห์
รับผลกำไรจากการเปลี่ยนแปลงอัตราสกุลเงินดิจิทัลกับ InstaForex.
ดาวน์โหลด MetaTrader 4 และเปิดการซื้อขายครั้งแรกของคุณ.
GBP/USD: เคล็ดลับการเทรดง่ายๆ สำหรับนักเทรดมือใหม่ในวันที่ 12 มิถุนายน (ช่วงตลาดสหรัฐฯ) การทดสอบระดับราคาที่ 1.3570 ในช่วงครึ่งแรกของวัน สอดคล้องกับตัวบ่งชี้ MACD ที่เพิ่งเริ่มเคลื่อนตัวลงจากเส้นศูนย์ ซึ่งยืนยันจุดขายเงินปอนด์ได้อย่างถูกต้องและทำให้เกิดการลดลงมากกว่า 40 pips ข้อมูลทางเศรษฐกิจของสหราชอาณาจักรที่อ่อนแอได้กดดันเงินปอนด์อย่างรุนแรงอีกครั้ง นักลงทุนที่กังวลเกี่ยวกับความเสี่ยงของภาวะเศรษฐกิจถดถอยได้ขายเงินปอนด์หลังจากข้อมูลเผยแพร่ แต่การขายทิ้งในวงกว้างไม่เกิดขึ้นเนื่องจากจุดอ่อนของเงินดอลลาร์สหรัฐได้กลับมาอยู่ในจุดสนใจอีกครั้ง ต่อมาในวันนี้ สหรัฐฯ จะเผยแพร่ดัชนีราคาผู้ผลิต
  • Grand Choice
    Contest by
    InstaForex
    InstaForex always strives to help you
    fulfill your biggest dreams.
    เข้าร่วมการแข่งขัน


บทความแนะนำ

วิธีการเทรดคู่เงิน GBP/USD ในวันที่ 12 มิถุนายน? เคล็ดลับง่ายๆ และการวิเคราะห์การเทรดสำหรับผู้เริ่มต้น

เมื่อวันพุธ คู่สกุลเงิน GBP/USD เคลื่อนไหวในลักษณะคล้ายกับคู่สกุลเงิน EUR/USD รายงานอัตราเงินเฟ้อของสหรัฐฯ กลายเป็นแรงขับเคลื่อนใหม่สำหรับการลดลงของดอลลาร์สหรัฐฯ แม้ว่าตัวเลขจะไม่ถือว่าหายนะก็ตาม อัตราเงินเฟ้อที่ยังคงอยู่ที่ 2.8% เมื่อเทียบแบบปีต่อปี หมายความว่าไม่มีการเปลี่ยนแปลงใด ๆ เกิดขึ้น อย่างไรก็ตาม

Paolo Greco 06:05 2025-06-12 UTC+2

เคล็ดลับและการวิเคราะห์การเทรดคู่สกุลเงิน EUR/USD ในวันที่ 12 มิถุนายน สำหรับมือใหม่

เมื่อวันพุธ คู่สกุลเงิน EUR/USD ได้กลับมาสู่แนวโน้มขาขึ้นอีกครั้ง ซึ่งได้ดำเนินมาต่อเนื่องมากกว่าสี่เดือน โดยเฉพาะอย่างยิ่งหลังจากที่ Donald Trump ได้เข้าเป็นประธานาธิบดี สิ่งที่เราเห็นคือคู่สกุลเงินนี้ปรับตัวขึ้นอย่างรวดเร็ว ปรับฐานลงอย่างอ่อน หรือเคลื่อนไหวแบบทรงตัวในกรอบราคาหนึ่ง ตัวอย่างเช่น สัปดาห์นี้คู่สกุลเงินเคลื่อนไหวแบบทรงตัวในช่วงราคาที่แคบเป็นเวลา 2.5

Paolo Greco 06:05 2025-06-12 UTC+2

คำแนะนำและการวิเคราะห์การซื้อขายสำหรับ GBP/USD เมื่อวันที่ 12 มิถุนายน: เงินปอนด์พบเหตุผลใหม่ในการดีใจ

ในวันพุธที่ผ่านมา สกุลเงิน GBP/USD ได้กลับมาขยับขึ้นอีกครั้ง ตามที่ได้กล่าวไว้ก่อนหน้านี้ สกุลเงินอังกฤษในปัจจุบันไม่มีเหตุผลที่ชัดเจนที่จะลดลงเมื่อเปรียบเทียบกับดอลลาร์สหรัฐ โดยเฉพาะกับดอลลาร์สหรัฐ ตลาดยังคงจับปัจจัยหรือข้ออ้างใด ๆ ที่จะขายเงินดอลลาร์ ผู้ค้าก็เริ่มไม่เชื่อในคำกล่าวของ Donald Trump ที่อ้างถึงอนาคตที่ดีและข้อตกลงที่ทำกำไรได้ ประชาชนชาวอเมริกันออกมาเดินประท้วงนโยบายการอพยพของพรรครีพับลิกัน

Paolo Greco 04:00 2025-06-12 UTC+2

คำแนะนำการซื้อขายและการวิเคราะห์ EUR/USD สำหรับวันที่ 12 มิถุนายน: แม้แต่เงินเฟ้อก็ไม่ทำให้ดอลลาร์พอใจ

คู่สกุลเงิน EUR/USD มีการซื้อขายในรูปแบบที่แตกต่างกันมากตลอดทั้งวันพุธ ระหว่างช่วงการซื้อขายในยุโรป คู่เงินยังคงเคลื่อนไหวด้านข้าง ซึ่งมีรูปแบบเช่นนี้มาหลายวัน ไม่มีปัจจัยพื้นฐานขนาดใหญ่ในขณะนั้น อีกทั้งตลาดไม่ได้รับแรงกระตุ้นจากคำกล่าวใหม่ของ Donald Trump เกี่ยวกับการทำข้อตกลงการค้ากับจีน เพราะในท้ายที่สุดทุกคนเข้าใจถึงความไม่จริงของคำกล่าวเช่นนั้น ในการประชุมครั้งที่สองที่ London จีนและสหรัฐฯ

Paolo Greco 03:55 2025-06-12 UTC+2

GBP/USD: แผนการซื้อขายสำหรับช่วงการเงินสหรัฐฯ ในวันที่ 11 มิถุนายน (รีวิวการซื้อขายช่วงเช้า)

ในรายงานพยากรณ์ตอนเช้าของฉัน ฉันได้เน้นไปที่ระดับ 1.3483 และวางแผนที่จะตัดสินใจในการเทรดตามนั้น มาดูกราฟ 5 นาทีและวิเคราะห์เหตุการณ์ที่เกิดขึ้น การปรับตัวขึ้นและการเกิดจุดผิดพลาดหลอกในระดับนั้นนำไปสู่การเข้าเทรดขาลง ส่งผลให้ราคาลดลง 20 จุด ภาพเทคนิคถูกปรับปรุงใหม่สำหรับช่วงครึ่งหลังของวัน เปิดตำแหน่งซื้อใน GBP/USD: ข้อมูล

Miroslaw Bawulski 18:41 2025-06-11 UTC+2

EUR/USD: แผนการซื้อขายสำหรับเซสชั่นในสหรัฐอเมริกาวันที่ 11 มิถุนายน (การทบทวนการซื้อขายช่วงเช้า)

ในคำพยากรณ์ช่วงเช้าของฉัน ฉันได้เน้นถึงระดับ 1.1425 และวางแผนที่จะตัดสินใจเข้าซื้อขายตามระดับนี้ มาดูกราฟ 5 นาทีและตรวจสอบว่าเกิดอะไรขึ้นบ้าง ราคาปรับตัวขึ้นเหนือ 1.1425 แต่ไม่มีการกลับตัวเพื่อลองทดสอบใหม่ ดังนั้นฉันจึงไม่ได้เปิดการซื้อขายใด ๆ ในช่วงครึ่งแรกของวัน มุมมองทางเทคนิคถูกปรับใหม่สำหรับช่วงครึ่งหลังของวัน การแข็งค่าขึ้นของยูโรจะขึ้นอยู่กับข้อมูลเงินเฟ้อของสหรัฐฯ

Miroslaw Bawulski 18:38 2025-06-11 UTC+2

วิธีการซื้อขายคู่เงิน GBP/USD ในวันที่ 11 มิถุนายน? เคล็ดลับง่าย ๆ และการวิเคราะห์การซื้อขายสำหรับมือใหม่

ในวันอังคาร คู่เงิน GBP/USD มีแนวโน้มลดลง ซึ่งเกิดจากหลายปัจจัย อย่างแรกคู่เงินได้ย่อต่ำกว่าระดับแนวโน้มขาขึ้น เราไม่เชื่อว่าแนวโน้มการลดลงใหม่ของเงินปอนด์อังกฤษจะเริ่มต้น เนื่องจาก Donald Trump อาจกระตุ้นให้เกิดการขายเงินดอลลาร์และในขณะนี้ยังไม่มีข่าวบวกเกี่ยวกับหัวข้อสำคัญต่างๆ อย่างไรก็ตามเป็นครั้งคราวคู่เงินก็จำเป็นต้องมีการปรับตัวลงบ้าง สอง ตัวเลขสถิติทางเศรษฐกิจของสหราชอาณาจักรออกมาอ่อนแอมาก อัตราการว่างงานเพิ่มขึ้นและจำนวนคนยื่นขอรับสวัสดิการคนว่างงานสูงกว่าการคาดการณ์ถึงสามเท่า

Paolo Greco 06:10 2025-06-11 UTC+2

วิธีการเทรดคู่สกุลเงิน EUR/USD ในวันที่ 11 มิถุนายน? เคล็ดลับง่าย ๆ และการวิเคราะห์การเทรดสำหรับผู้เริ่มต้น

เมื่อวันอังคาร คู่สกุลเงิน EUR/USD แสดงให้เห็นว่าไม่มีความตั้งใจที่จะทำการค้าอย่างจริงจังอีกครั้ง ในช่วงสามวันที่ผ่านมามีช่องทางเคลื่อนไหวข้างที่เกิดขึ้นในกรอบเวลาแบบรายชั่วโมง และความผันผวนของคู่สกุลเงินนี้ยังคงอยู่ในระดับต่ำมาก ในแง่หนึ่งนี่ถือว่าเข้าใจได้ — ไม่มีพื้นฐานทางเศรษฐกิจมหภาคในช่วงนี้ และตลาดไม่ได้ตอบสนองต่อข่าวเกี่ยวกับการประท้วงในสหรัฐฯ การปราบปราม หรือการเจรจาการค้าระหว่างสหรัฐฯ กับจีน อย่างไรก็ตาม การประท้วงในสหรัฐฯ

Paolo Greco 06:10 2025-06-11 UTC+2

คำแนะนำและการวิเคราะห์การเทรด GBP/USD ประจำวันที่ 11 มิถุนายน: เงินปอนด์หยุดพักก่อนที่จะทะยานขึ้นครั้งใหม่

คู่สกุลเงิน GBP/USD ยังคงซื้อขายค่อนข้างยุ่งเหยิงในวันอังคารแต่มีแนวโน้มขาลง ค่าเงินปอนด์ของอังกฤษลดลงเล็กน้อยหลังจากแนวโน้มเปลี่ยนไปในทิศทางขาลง จำได้ว่าเมื่อไม่กี่วันก่อน ราคาทะลุผ่านแนวโน้มอีกเส้นหนึ่ง (หรือช่องราคา) ซึ่งบ่งชี้ถึงการก่อตัวของแนวโน้มขาลงใหม่ อย่างไรก็ตาม, ในกรณีก่อนหน้านี้ เราไม่เห็นการลดลงที่ชัดเจนใด ๆ และแม้ว่าจะมีก็จบลงอย่างรวดเร็ว ในหลักการ เราได้พูดสิ่งเดิมๆ

Paolo Greco 03:31 2025-06-11 UTC+2

คำแนะนำและการวิเคราะห์การซื้อขายสำหรับ EUR/USD ในวันที่ 11 มิถุนายน: การเคลื่อนไหวแบบคงที่ในระดับสูง

คู่สกุลเงิน EUR/USD ยังคงเคลื่อนไหวในทั้งสองทิศทางตลอดวันอังคาร การเคลื่อนไหวเหล่านี้บ่งบอกถึงตลาดที่ค่อนข้างนิ่งมาก่อนหน้านี้ โดยคู่สกุลเงินได้ทำการแตกผ่านเส้นแนวโน้มขาขึ้นเป็นครั้งที่สอง ซึ่งไม่ก่อให้เกิดการลดลงอย่างชัดเจน ดังนั้นอีกครั้งที่ดอลลาร์สหรัฐไม่สามารถเสริมความแข็งแกร่งให้กับตัวมันเองได้ แม้ว่าจะมีเหตุผลที่สมควรพอในการทำเช่นนั้นก็ตาม ก่อนหน้านี้ เราเจอสถานการณ์หลายครั้งที่ข้อมูลเศรษฐกิจมหภาคที่ดีหรือสภาพพื้นฐานทางการเงินที่แข็งแกร่งไม่ได้นำไปสู่การแข็งค่าของดอลลาร์สหรัฐ ตลาดมักจะมองข้ามสิ่งเหล่านี้แล้วไปสนใจในเหตุการณ์ที่ใหญ่กว่าและสำคัญกว่า ซึ่งแน่นอนว่าเกี่ยวพันกับ Donald Trump ดังนั้นมันจึงเกิดขึ้นบ่อยครั้งที่ดอลลาร์ปฏิเสธที่จะขึ้นราคา

Paolo Greco 03:31 2025-06-11 UTC+2
หากไม่สะดวกคุยในตอนนี้
ระบุคำถามไว้ได้ใน แชท.
Widget callback
 

Dear visitor,

Your IP address shows that you are currently located in the USA. If you are a resident of the United States, you are prohibited from using the services of InstaFintech Group including online trading, online transfers, deposit/withdrawal of funds, etc.

If you think you are seeing this message by mistake and your location is not the US, kindly proceed to the website. Otherwise, you must leave the website in order to comply with government restrictions.

Why does your IP address show your location as the USA?

  • - you are using a VPN provided by a hosting company based in the United States;
  • - your IP does not have proper WHOIS records;
  • - an error occurred in the WHOIS geolocation database.

Please confirm whether you are a US resident or not by clicking the relevant button below. If you choose the wrong option, being a US resident, you will not be able to open an account with InstaForex anyway.

We are sorry for any inconvenience caused by this message.