empty
22.09.2023 09:25 AM
EUR/USD trading plan for September 22, 2023. COT report and overview of yesterday's trades. EUR to move lower following PMI release

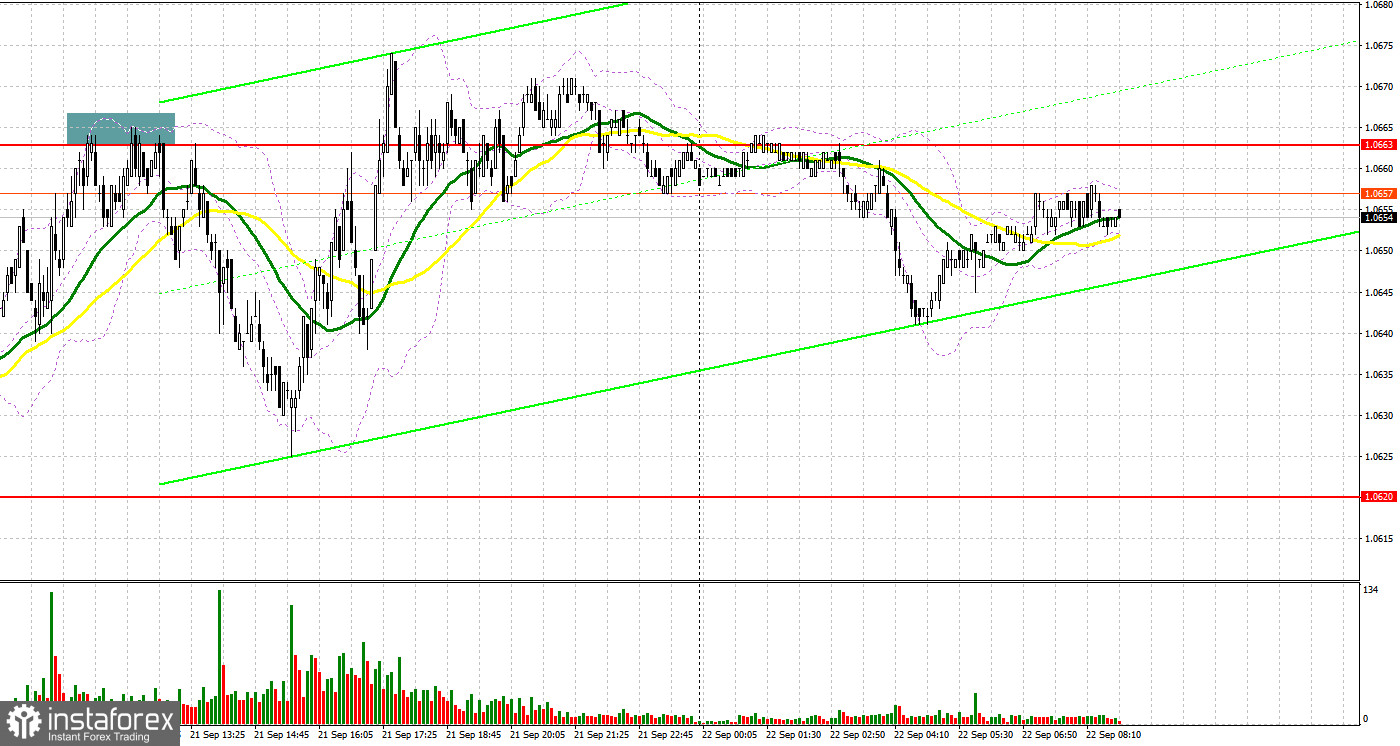
Yesterday, the pair formed only one signal to enter the market. Let's have a look at what happened on the 5-minute chart. In my morning review, I mentioned the level of 1.0663 as a possible entry point. A rise to this level and its false breakout served as a signal to sell the euro and sent it down by more than 40 pips. In the afternoon, no good entry signals were formed.

This image is no longer relevant

For long positions on EUR/USD:

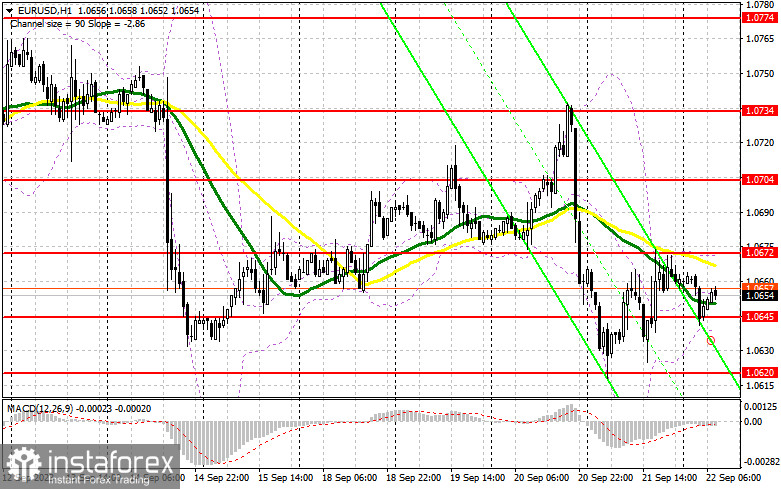
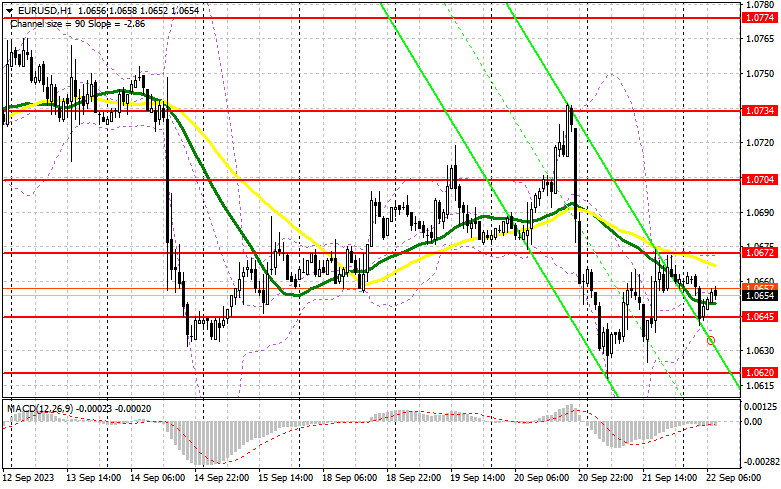
A decrease in US unemployment claims has resulted in another strengthening of the US dollar on Thursday in the second part of the day. However, the pair couldn't surpass its monthly lows. It appears that sellers might repeat this attempt today. The reason for a potential further decline in the pair would be data related to the Eurozone's manufacturing PMI, services sector PMI, and composite PMI. We expect weak indicators across the board, signaling reduced activity, which is concerning for the prospects of the European currency and economy. Consequently, I plan to act against the bearish trend only when the pair dips around the nearest support at 1.0645. A false breakout there will provide a favorable entry point for long positions, anticipating a bullish correction towards the end of the week with a target at the resistance of 1.0672. A successful break and subsequent top-down test of this range, given positive Eurozone macroeconomic indicators, will stimulate demand for the euro, providing an opportunity for a leap to 1.0704. The ultimate target would be the 1.0734 area, where I will lock in profits. If EUR/USD continues its descent and no activity manifests around 1.0645 (which seems probable), the bearish trend will prevail. Only a false breakout around 1.6020 will serve as a market entry signal. I will open long positions on a rebound immediately from 1.0590, aiming for a bullish correction of 30-35 pips within the day.

For short positions on EUR/USD:

Sellers remain in control despite a minor correction observed yesterday afternoon. Evidently, to develop a new bearish trend, sellers need unfavorable statistics from the Eurozone and strong resistance at 1.0672, just below which moving averages are found. A false breakout at this level will serve as a great entry point for short positions, with a target to descend to the interim support at 1.0645. Only after breaking below and settling beneath this range, followed by a bottom-up retest, do I anticipate another sell signal with targets at 1.0620 and 1.0590 — the new monthly low, where substantial buyers are expected to emerge. The furthest target would be the 1.0554 area, where I will lock in profits. If the EUR/USD rises during the European session and bears are absent at 1.0672, buyers might have a favorable opportunity to recover by the week's end. In such a scenario, I will postpone selling the pair until the price hits the new resistance at 1.0704. I would consider selling there, but only after a failed consolidation. I will open short positions immediately on a rebound from the 1.0734 high, targeting a bearish correction of 30-35 pips.

This image is no longer relevant

COT report

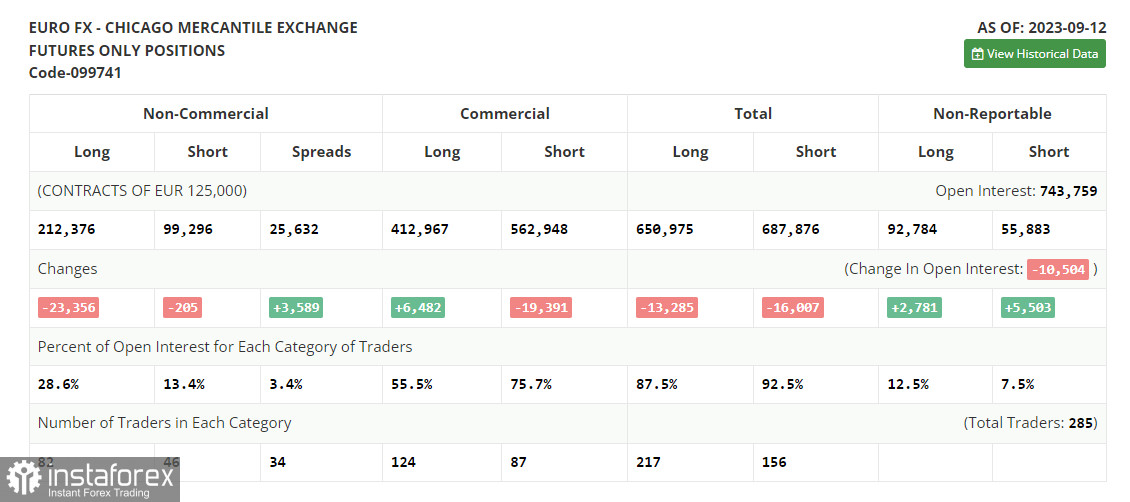
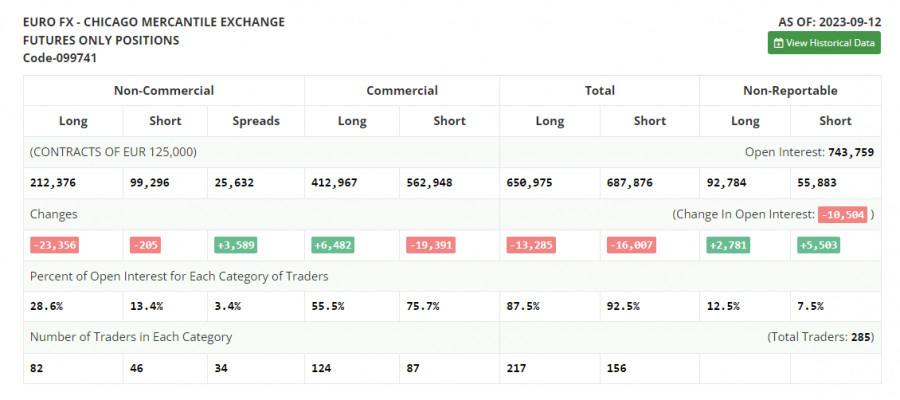
The Commitments of Traders report for September 12 revealed a sharp drop in long positions and a modest decline in the long ones. This decline can be attributed to some significant negative developments in the Eurozone economy and a downward revision of the GDP for the second quarter. Despite these setbacks, the European Central Bank (ECB) made a decision to hike interest rates. Such a move in the given scenario could have unfavorable implications in the near term and it might have triggered a sharp depreciation of the European currency. In the coming days, all eyes will be on the Federal Reserve's meeting. Should the committee also decide to increase rates, the euro could face further declines against the dollar. Therefore, it would be wise to exercise caution before making any purchases in the current environment. The COT report indicates a drop in non-commercial long positions by 23,356 to 212,376. On the other hand, non-commercial short positions saw a minor decrease of 205, standing at 99,296. Consequently, the spread between long and short positions expanded by 6,589. The closing price fell to 1.0736 compared to the previous value of 1.0728, signaling a bearish market trend.

This image is no longer relevant

Indicator signals:

Moving Averages

Trading below the 30- and 50-day moving averages indicates a further decline in the pair.

Please note that the time period and levels of the moving averages are analyzed only for the H1 chart, which differs from the general definition of the classic daily moving averages on the D1 chart.

Bollinger Bands

If the pair declines, the lower band of the indicator at 1.0640 will act as support.

Description of indicators:

• A moving average of a 50-day period determines the current trend by smoothing volatility and noise; marked in yellow on the chart;

• A moving average of a 30-day period determines the current trend by smoothing volatility and noise; marked in green on the chart;

• MACD Indicator (Moving Average Convergence/Divergence) Fast EMA with a 12-day period; Slow EMA with a 26-day period. SMA with a 9-day period;

• Bollinger Bands: 20-day period;

• Non-commercial traders are speculators such as individual traders, hedge funds, and large institutions who use the futures market for speculative purposes and meet certain requirements;

• Long non-commercial positions represent the total number of long positions opened by non-commercial traders;

• Short non-commercial positions represent the total number of short positions opened by non-commercial traders;

• The non-commercial net position is the difference between short and long positions of non-commercial traders.

เลือกช่วงเวลา
5
นาที
15
นาที
30
นาที
1
ชั่วโมง
4
ชั่วโมง
1
วัน
1
สัปดาห์
รับผลกำไรจากการเปลี่ยนแปลงอัตราสกุลเงินดิจิทัลกับ InstaForex.
ดาวน์โหลด MetaTrader 4 และเปิดการซื้อขายครั้งแรกของคุณ.
USD/CAD: การวิเคราะห์และการพยากรณ์ คู่เงิน USD/CAD กำลังแสดงการฟื้นตัวเล็กน้อยจากระดับที่ต่ำกว่า 1.3600 โดยย้อนไปเกือบทั้งหมดของการสูญเสียในวันที่ผ่านมา โดยได้รับการสนับสนุนจากการฟื้นตัวของดอลลาร์สหรัฐ นอกจากนี้ ความกังวลเกี่ยวกับการหยุดชะงักในการจัดหาน้ำมันในตะวันออกกลางกำลังผลักดันราคาน้ำมันดิบให้พุ่งขึ้นอย่างรวดเร็ว ทำให้ราคาของน้ำมันแตะระดับสูงสุดในรอบห้าเดือน เนื่องจากเงินดอลลาร์แคนาดาเป็นสกุลเงินที่เชื่อมโยงกับสินค้าโภคภัณฑ์ ราคาน้ำมันจึงส่งผลต่อค่าของมันเป็นอย่างมาก ประกอบกับความเป็นไปได้ที่ลดลงของการปรับลดอัตราดอกเบี้ยเพิ่มเติมจากธนาคารกลางแคนาดาและความคาดหวังต่อข้อตกลงการค้าระหว่างสหรัฐอเมริกาและแคนาดา ปัจจัยเหล่านี้ช่วยสนับสนุนเงินดอลลาร์แคนาดา โอกาสทางการค้าที่ดีขึ้นและนโยบายการเงินของแคนาดาที่มีเสถียรภาพอาจช่วยให้
  • Grand Choice
    Contest by
    InstaForex
    InstaForex always strives to help you
    fulfill your biggest dreams.
    เข้าร่วมการแข่งขัน


บทความแนะนำ

GBP/USD: แผนการซื้อขายสำหรับช่วงตลาดอเมริกันวันที่ 13 มิถุนายน (รีวิวการซื้อขายช่วงเช้า)

ในคำพยากรณ์ช่วงเช้าของฉัน ฉันได้เน้นไปที่ระดับ 1.3531 และวางแผนตัดสินใจการซื้อขายตามระดับนี้ มาดูกราฟ 5 นาทีและวิเคราะห์สิ่งที่เกิดขึ้น การลดลงตามมาด้วยการฝ่าวงล้อมเท็จที่ระดับนี้ นำไปสู่การเข้าซื้อที่ยาวนานบนปอนด์ ส่งผลให้เกิดการขึ้นมากกว่า 35 จุด ภาพทางเทคนิคไม่ได้รับการปรับปรุงสำหรับช่วงครึ่งหลังของวัน การเปิดสถานะ Long

Miroslaw Bawulski 12:37 2025-06-13 UTC+2

EUR/USD: แผนการเทรดสำหรับการซื้อขายในสหรัฐอเมริกา วันที่ 13 มิถุนายน (รีวิวการซื้อขายในช่วงเช้า)

ในการวิเคราะห์ในช่วงเช้า ผมได้เน้นที่ระดับ 1.1556 และวางแผนการตัดสินใจเข้าตลาดตามจุดนี้ มาดูกราฟ 5 นาทีและวิเคราะห์ว่าเกิดอะไรขึ้น การเพิ่มขึ้นและการเกิดสัญญาณหลอก ๆ รอบระดับ 1.1556 ทำให้มีการเปิดตำแหน่งขา short ในยูโร ซึ่งส่งผลให้เกิดการเคลื่อนไหวมากกว่า

Miroslaw Bawulski 12:31 2025-06-13 UTC+2

วิธีการเทรดคู่สกุลเงิน GBP/USD ในวันที่ 13 มิถุนายน? เคล็ดลับง่าย ๆ และการวิเคราะห์การเทรดสำหรับมือใหม่

ในวันพฤหัสบดี คู่เงิน GBP/USD แสดงการเคลื่อนไหวขึ้นที่ค่อนข้างแข็งแกร่ง แม้ว่าปอนด์จะมีการลดลงในระหว่างวันก็ตาม มีการพัฒนาข่าวมากมาย เช่น ในช่วงตลาดยุโรป เงินปอนด์ถูกกดดันจากรายงาน GDP และการผลิตภาคอุตสาหกรรมของเดือนเมษายน — ทั้งสองตัวบ่งชี้ต่ำกว่าที่คาดการณ์ไว้และแสดงอัตราการเติบโตที่เป็นลบ แม้กระนั้น รายงานจากสหรัฐอเมริกาภายหลังแสดงว่า

Paolo Greco 06:31 2025-06-13 UTC+2

วิธีการซื้อขายคู่สกุลเงิน EUR/USD ในวันที่ 13 มิถุนายน? เคล็ดลับง่าย ๆ และการวิเคราะห์การซื้อขายสำหรับมือใหม่

คู่สกุลเงิน EUR/USD ในวันพฤหัสบดีและช่วงกลางคืนเข้าสู่วันศุกร์แสดงลักษณะ "การวิ่งแข่งแบบอเมริกัน" ในช่วงสองวันที่ผ่านมา ดอลลาร์สหรัฐฯ ได้ร่วงลงอีกครั้งเนื่องจากการประท้วงและการก่อจลาจลยังคงเป็นไปอย่างต่อเนื่องทั่วหลายเมืองในอเมริกา เพื่อตอบโต้ต่อนโยบายการอพยพของ Donald Trump ขณะเดียวกัน Trump ได้ประกาศความตั้งใจที่จะเพิ่มความตึงเครียดด้วยการเพิ่มอัตราภาษีทางการค้ากับประเทศทั้งหมดที่อยู่ใน "บัญชีดำ" ของเขา

Paolo Greco 06:31 2025-06-13 UTC+2

คำแนะนำและการวิเคราะห์การซื้อขายสำหรับ GBP/USD ในวันที่ 13 มิถุนายน: GDP ที่อ่อนแอทำให้ภาพรวมค่าเงินปอนด์แย่ลง

เมื่อวันพฤหัสบดีที่ผ่านมา คู่สกุลเงิน GBP/USD ยังคงเคลื่อนไหวในทิศทางที่เพิ่มขึ้น อย่างไรก็ตาม ต้องบอกว่าเป็นเรื่องที่น่าแปลกใจเล็กน้อยที่ในสัปดาห์นี้ค่าเงินปอนด์แข็งค่าขึ้นน้อยกว่าค่าเงินยูโร ค่าเงินปอนด์อังกฤษอยู่ภายใต้แรงกดดันจากรายงานการจ้างงานและจากนั้นก็มาจากข้อมูล GDP และข้อมูลการผลิตอุตสาหกรรม แม้ว่าก่อนหน้านี้เราจะตั้งข้อสังเกตว่ารายงานเหล่านี้ไม่มีความสำคัญมากนัก แต่ตลาดก็ยังคงตอบสนองอย่างมาก ที่สำคัญที่สุด รายงานชี้ให้เห็นถึงการลดลงของค่าเงินปอนด์ และ—แปลกใจมาก!—ตลาดในที่สุดก็ยังคงตอบสนองต่อรายงานในทางที่เป็นผลดีต่อค่าเงินดอลลาร์สหรัฐ อย่างไรก็ตาม

Paolo Greco 03:41 2025-06-13 UTC+2

คำแนะนำและการวิเคราะห์การซื้อขายสำหรับ EUR/USD ณ วันที่ 13 มิถุนายน: ทรัมป์เตือนเกี่ยวกับการเพิ่มภาษี

สกุลเงินคู่ EUR/USD ยังคงเคลื่อนที่ขึ้นอย่างแข็งแกร่งในวันพฤหัสบดี ซึ่งเริ่มต้นจากวันพุธ การถอยกลับลงเริ่มต้นเมื่อสิ้นสุดวัน แต่มีอ่อนแรงกว่าการเพิ่มขึ้นก่อนหน้านี้ การลดลงอีกระลอกหนึ่งของดอลลาร์สหรัฐเริ่มต้นหลังจากการประกาศข้อมูลเงินเฟ้อในสหรัฐฯ ซึ่งออกมาต่ำกว่าที่คาดการณ์ไว้ อย่างไรก็ตาม เราไม่เชื่อมโยงรายงานนี้โดยตรงกับการลดลงใหม่ของดอลลาร์ เงินเฟ้อออกมาต่ำกว่าความคาดหวังของตลาด แต่ยังคงเพิ่มขึ้นเล็กน้อยในเดือนพฤษภาคม หมายความว่าอย่างไร? หมายความว่าเงินเฟ้อกำลังเพิ่มขึ้น ดังนั้น

Paolo Greco 03:40 2025-06-13 UTC+2

วิธีการเทรดคู่เงิน GBP/USD ในวันที่ 12 มิถุนายน? เคล็ดลับง่ายๆ และการวิเคราะห์การเทรดสำหรับผู้เริ่มต้น

เมื่อวันพุธ คู่สกุลเงิน GBP/USD เคลื่อนไหวในลักษณะคล้ายกับคู่สกุลเงิน EUR/USD รายงานอัตราเงินเฟ้อของสหรัฐฯ กลายเป็นแรงขับเคลื่อนใหม่สำหรับการลดลงของดอลลาร์สหรัฐฯ แม้ว่าตัวเลขจะไม่ถือว่าหายนะก็ตาม อัตราเงินเฟ้อที่ยังคงอยู่ที่ 2.8% เมื่อเทียบแบบปีต่อปี หมายความว่าไม่มีการเปลี่ยนแปลงใด ๆ เกิดขึ้น อย่างไรก็ตาม

Paolo Greco 06:05 2025-06-12 UTC+2

เคล็ดลับและการวิเคราะห์การเทรดคู่สกุลเงิน EUR/USD ในวันที่ 12 มิถุนายน สำหรับมือใหม่

เมื่อวันพุธ คู่สกุลเงิน EUR/USD ได้กลับมาสู่แนวโน้มขาขึ้นอีกครั้ง ซึ่งได้ดำเนินมาต่อเนื่องมากกว่าสี่เดือน โดยเฉพาะอย่างยิ่งหลังจากที่ Donald Trump ได้เข้าเป็นประธานาธิบดี สิ่งที่เราเห็นคือคู่สกุลเงินนี้ปรับตัวขึ้นอย่างรวดเร็ว ปรับฐานลงอย่างอ่อน หรือเคลื่อนไหวแบบทรงตัวในกรอบราคาหนึ่ง ตัวอย่างเช่น สัปดาห์นี้คู่สกุลเงินเคลื่อนไหวแบบทรงตัวในช่วงราคาที่แคบเป็นเวลา 2.5

Paolo Greco 06:05 2025-06-12 UTC+2

คำแนะนำและการวิเคราะห์การซื้อขายสำหรับ GBP/USD เมื่อวันที่ 12 มิถุนายน: เงินปอนด์พบเหตุผลใหม่ในการดีใจ

ในวันพุธที่ผ่านมา สกุลเงิน GBP/USD ได้กลับมาขยับขึ้นอีกครั้ง ตามที่ได้กล่าวไว้ก่อนหน้านี้ สกุลเงินอังกฤษในปัจจุบันไม่มีเหตุผลที่ชัดเจนที่จะลดลงเมื่อเปรียบเทียบกับดอลลาร์สหรัฐ โดยเฉพาะกับดอลลาร์สหรัฐ ตลาดยังคงจับปัจจัยหรือข้ออ้างใด ๆ ที่จะขายเงินดอลลาร์ ผู้ค้าก็เริ่มไม่เชื่อในคำกล่าวของ Donald Trump ที่อ้างถึงอนาคตที่ดีและข้อตกลงที่ทำกำไรได้ ประชาชนชาวอเมริกันออกมาเดินประท้วงนโยบายการอพยพของพรรครีพับลิกัน

Paolo Greco 04:00 2025-06-12 UTC+2

คำแนะนำการซื้อขายและการวิเคราะห์ EUR/USD สำหรับวันที่ 12 มิถุนายน: แม้แต่เงินเฟ้อก็ไม่ทำให้ดอลลาร์พอใจ

คู่สกุลเงิน EUR/USD มีการซื้อขายในรูปแบบที่แตกต่างกันมากตลอดทั้งวันพุธ ระหว่างช่วงการซื้อขายในยุโรป คู่เงินยังคงเคลื่อนไหวด้านข้าง ซึ่งมีรูปแบบเช่นนี้มาหลายวัน ไม่มีปัจจัยพื้นฐานขนาดใหญ่ในขณะนั้น อีกทั้งตลาดไม่ได้รับแรงกระตุ้นจากคำกล่าวใหม่ของ Donald Trump เกี่ยวกับการทำข้อตกลงการค้ากับจีน เพราะในท้ายที่สุดทุกคนเข้าใจถึงความไม่จริงของคำกล่าวเช่นนั้น ในการประชุมครั้งที่สองที่ London จีนและสหรัฐฯ

Paolo Greco 03:55 2025-06-12 UTC+2
หากไม่สะดวกคุยในตอนนี้
ระบุคำถามไว้ได้ใน แชท.
Widget callback
 

Dear visitor,

Your IP address shows that you are currently located in the USA. If you are a resident of the United States, you are prohibited from using the services of InstaFintech Group including online trading, online transfers, deposit/withdrawal of funds, etc.

If you think you are seeing this message by mistake and your location is not the US, kindly proceed to the website. Otherwise, you must leave the website in order to comply with government restrictions.

Why does your IP address show your location as the USA?

  • - you are using a VPN provided by a hosting company based in the United States;
  • - your IP does not have proper WHOIS records;
  • - an error occurred in the WHOIS geolocation database.

Please confirm whether you are a US resident or not by clicking the relevant button below. If you choose the wrong option, being a US resident, you will not be able to open an account with InstaForex anyway.

We are sorry for any inconvenience caused by this message.